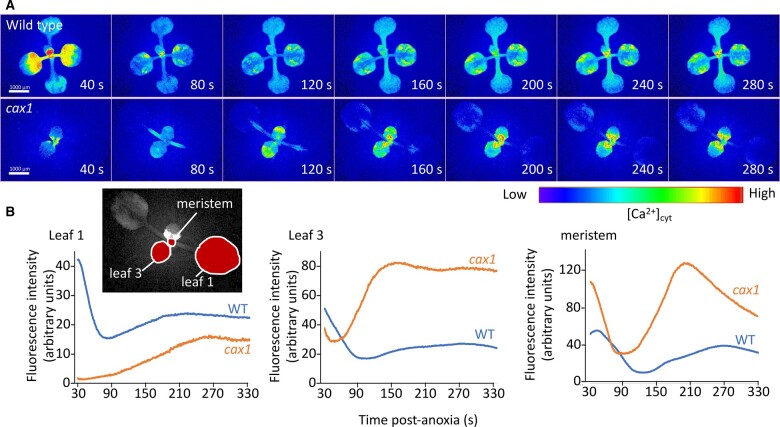
Figure 7.
Calcium changes in Col-0 and cax1 post anoxia. Plants were removed from their anoxic environment to normoxic conditions and then imaged using a fluorescence microscope. A, Images of plants expressing the gCaMP3 Ca2+ biosensor have had background subtracted and then fluorescence intensity pseudo-color coded according to the inset scale. Time is post transfer to normoxic conditions. B, Quantification of fluorescence of plants shown in (A). Fluorescence intensity was monitored in the regions of interest outlined in the inset. Representative of ≥10 independent plants.

