
Figure 3.
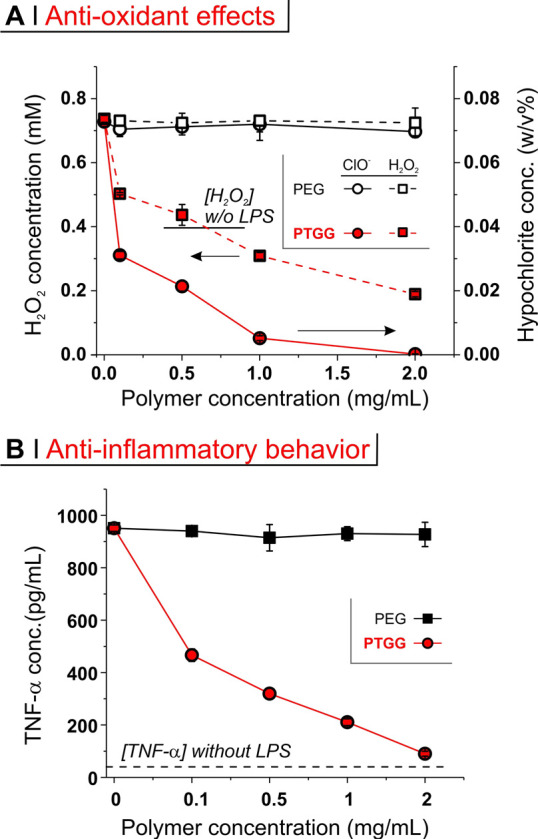
(A) Hydrogen peroxide (left axis, squares) and hypochlorite (right axis, circles) concentration in the cell lysates of RAW macrophages preactivated with 500 ng/mL LPS and exposed for 24 h to mPEG or PTGG30. Without LPS stimulation, hypochlorite was not detected, while H2O2 was present at about 0.4 mM, and it is noteworthy that high concentrations of PTGG reduced [H2O2] considerably below this basal level. (B) TNF-α concentration in RAW supernatants of preactivated RAW macrophages exposed to mPEG or PTGG30 for 24 h.