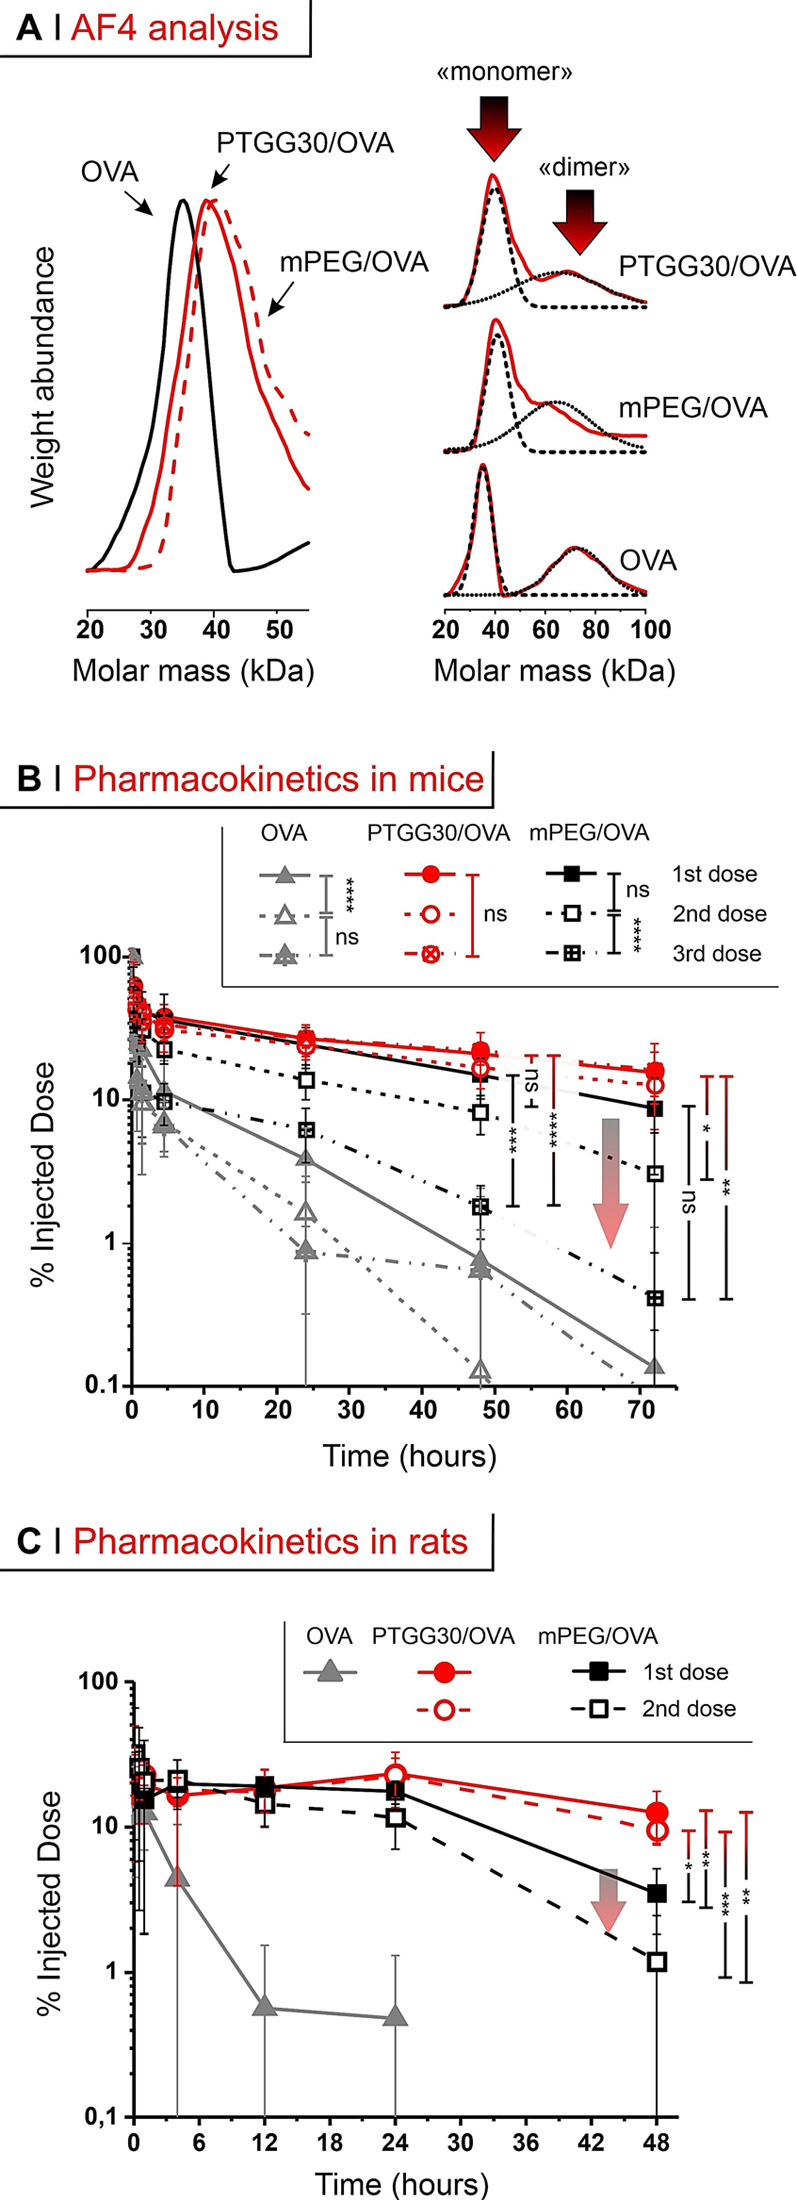
Figure 6.

(A) Left: molecular weight distributions obtained via AF4 (refractive index and static light scattering detectors). Right: the initial OVA and its conjugates have a bimodal distribution, not seen under the reducing conditions used in SDS-PAGE (Figure S4B). (B) % of ID in blood after tail vein injection at 500 μg/kg of OVA in mice; arrow highlights the ABC effect. (C) As in B, after tail vein injection in rats. A two-way and a one-way (with Tukey’s means comparison) ANOVA were respectively used to assess significance within treatment groups at different doses (legend) and between groups at 48 and 72 h; *P ≤ 0.05, **P ≤ 0.01, ***P ≤ 0.001, ****P ≤ 0.0001.
