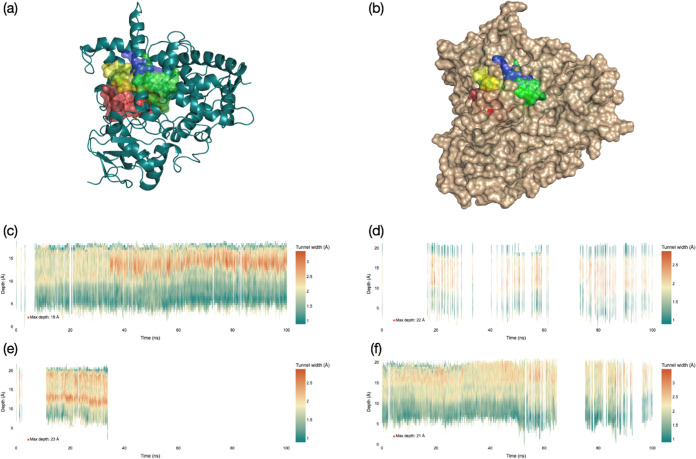
Figure 2.
Tunneling analysis for the entrance and exit channels in CYP1A1, leading to CpdI as obtained from the individual snapshots from the MD simulations for 100 ns with substrate starting orientation I, II, III, and IV. (a) Protein structure with the major tunnels for model I (in red), model II (in green), model III (in blue), and model IV (in yellow). (b) Same as part (a) but with the protein surface highlighted. (c–f) Tunneling information per snapshot (time frame on the x-axis) for the four MD simulations for model I (part c), II (part d), III (part e), and IV (part f). The horizontal axis represents the time segment from the MD simulation, while on the y-axis, the depth of the tunnel from the surface is given in Å. For each binding orientation, the deepest tunnel is shown.

