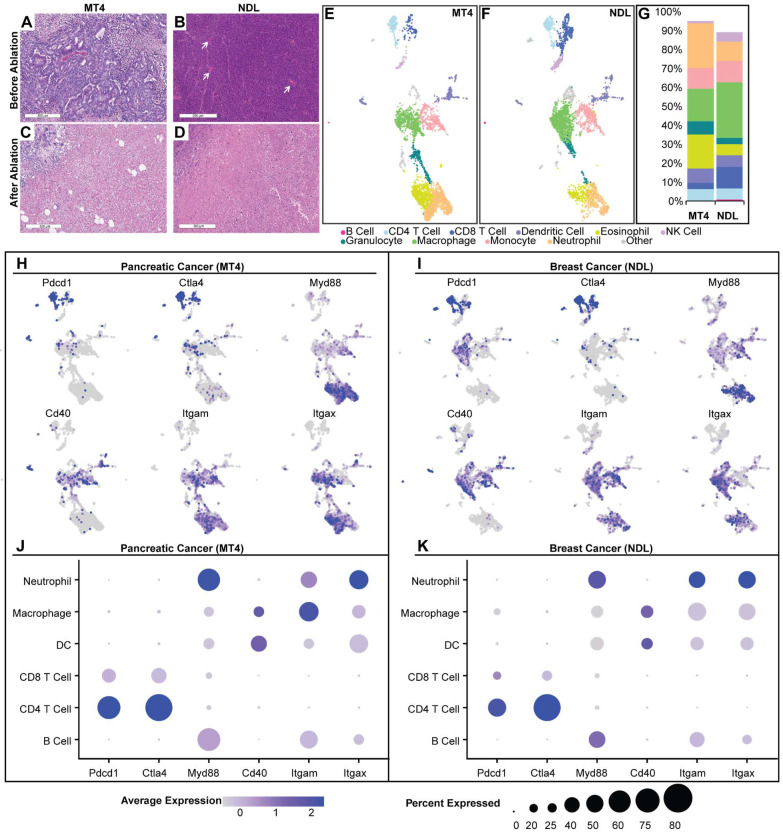
Figure 2.
Analysis of the naïve tumor microenvironment of MT4 pancreatic and NDL breast cancer models reveals distinct TMEs and immunological signatures. A-D) Hematoxylin and eosin staining before (A-B) and after (C-D) ablation in MT4 (A, C) and NDL (B, D) models. A) MT4 pancreatic ductal adenocarcinoma has decreased cellularity compared to B) NDL mammary adenocarcinoma, which is comparatively well vascularized (white arrows) with scattered leucocytes (black dots). E-K) Results of single-cell RNA sequencing, including Uniform Manifold Approximation and Projection (UMAP) plots for the MT4 (E) and NDL (F) tumors. B cells (dark pink) were CD19+, CD79+ and Ly6d+. T cells were CD3e+, with CD8+ (dark blue) and CD4+ (light blue) T cell subsets defined by CD8a and CD4, respectively. NK cells (lavender) were Klrb1b+ and Klrb1c+ (NK1.1+). Eosinophils (yellow) were Siglec-F+. Neutrophils (light orange) were Ly6g+. Monocytes (light pink) were Ly6c+, Ccr2+, Mrc1+, and Ccl9+. Macrophages (green) were Itgam+ and Adgre1+. Dendritic cells (purple) were Itgax+, H2-Ab1+, Fcgr1+, Ly6g-, Siglecf-, Klrb1c-. Granulocytes (turquoise) were Tmem189+, Sap30+, and Idha+. G) Quantitative summary of immune cells within each tumor model. The MT4 model has a smaller faction of CD8+ T cells, macrophages and NK cells compared to the NDL model. H-K) Gene expression distribution and levels across UMAP cell clusters in the MT4 (H, J) and NDL (I, K) models. In the MT4 model, overall cellular Myd88 expression levels are higher, and CD40 expression is higher in dendritic cell (DC) clusters compared to the NDL model. The MT4 model also has a greater fraction of both CD4+ and CD8+ T cells expressing PD-1, CD8+ T cells expressing CTLA4, and DCs expressing CD40. Scale bars represent 300 µm.

