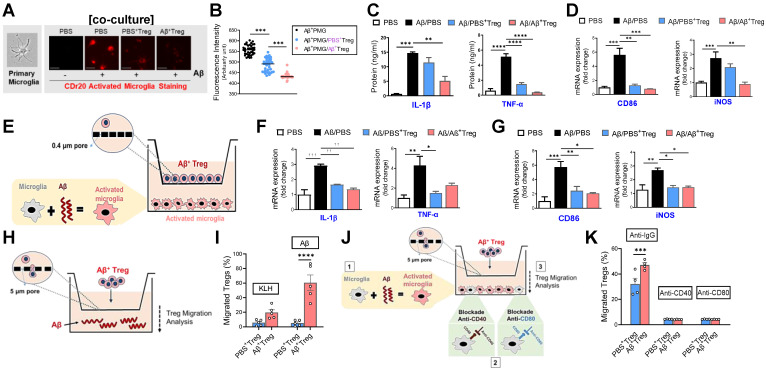
Figure 5.
Aβ-specific Tregs suppress Aβ-induced microglial inflammation via the bystander effect. (A) Representative images show the primary microglial activity after 30 min of Aβ (5 μM) treatment in the presence of CDr20. The scale bar represents 100 μm. (B) Fluorescence intensity of fifty randomly selected cocultured microglia and Treg cells after 30 min of Aβ treatment with CDr20 in the red fluorescent channel (excitation: 570 nm, emission: 600 nm). (C) The secreted levels of TNF-α and IL-1β in the supernatants of cocultured cells treated with Aβ for 6 h were measured by ELISA. (D) The relative mRNA expression levels of iNOS and CD86 in cocultured microglia and Treg cells were quantified. (E) Schematic diagram for the experiment using indirect coculture with a Transwell insert (0.4 μm) to confirm the inhibitory effect of Aβ+ Tregs. The relative mRNA expression levels of (F) the proinflammatory cytokines IL-1β and TNF-α and (G) the microglial activation markers CD86 and iNOS were quantified in activated microglia after 6 hrs of coculture. (H) Schematic diagram for the Aβ+ Treg migration assay. (I) The bar graph shows the percentage of Tregs that migrated toward Aβ compared to KLH. (J) Schematic diagram of the migration assay performed with Aβ+ Tregs and anti-CD40 or anti-CD80 antibody-treated primary microglia. (K) The bar graph shows the percentage of Tregs that migrated toward antibody-treated microglia. Data are presented as the mean ± SEM. n = 3-4 per group; * P < 0.05, ** P < 0.01, *** P < 0.001, **** P < 0.0001.

