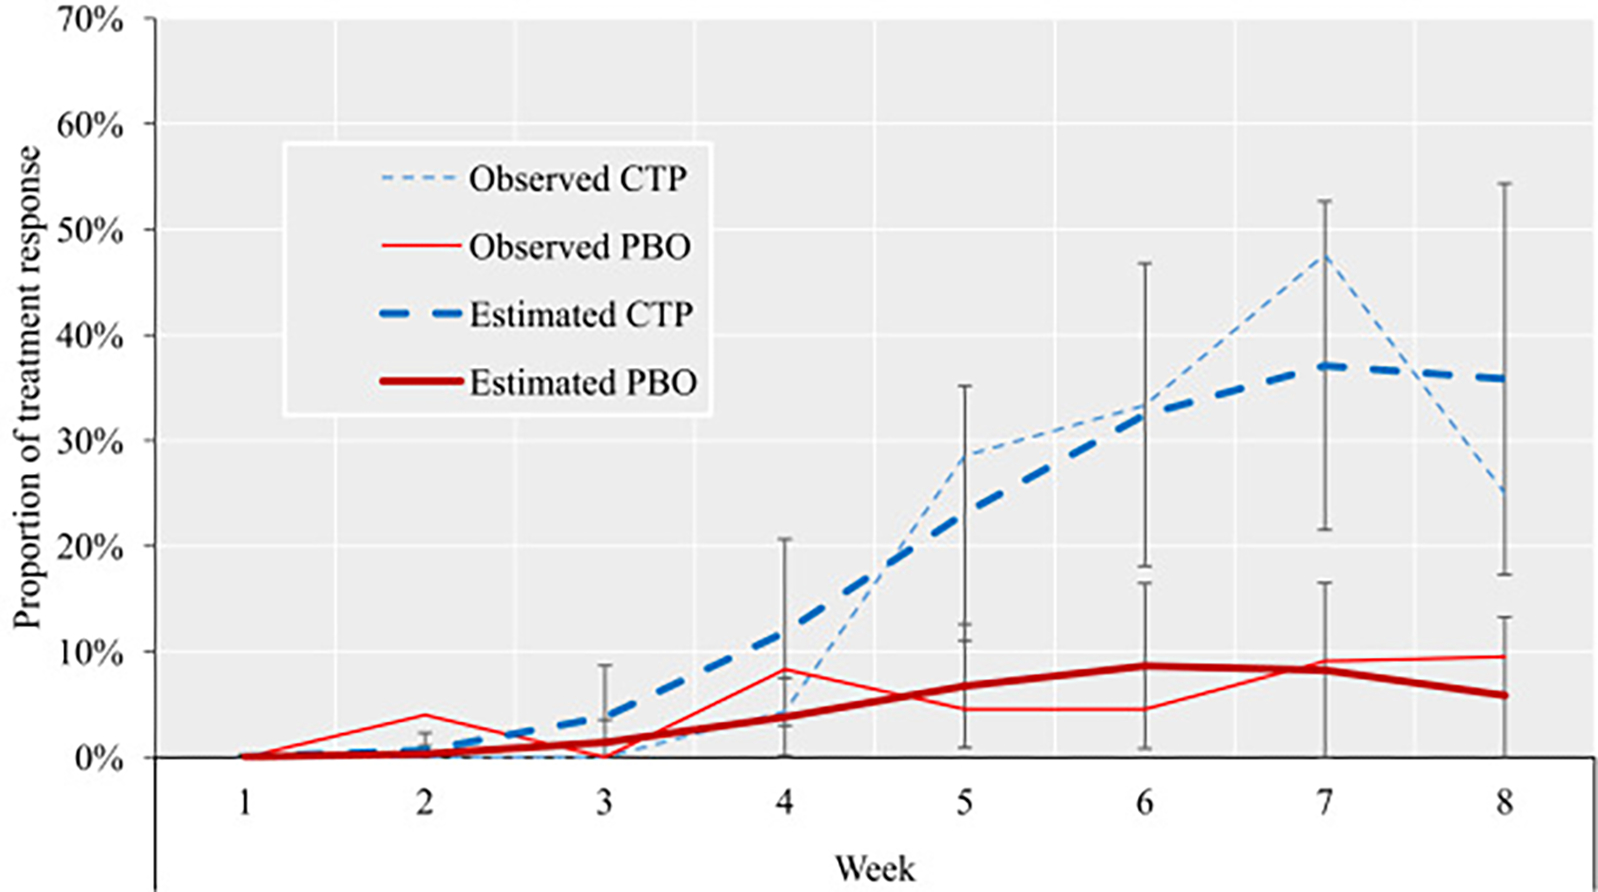
FIGURE 3. Proportion of Treatment Response by Week and Treatment Group.

Note: Both observed and estimated proportions of response are displayed. Bars represent 95% CI. Estimated proportions were extracted with command margins in Stata and are based on n = 49. Observed proportions are based on n = 49 at week 1; n = 48 at week 2; n = 47 at weeks 3 and 4; n = 43 at weeks 5, 6, and 7; and n = 41 at week 8. CTP = citalopram; PBO = placebo. Please note color figures are available online.
