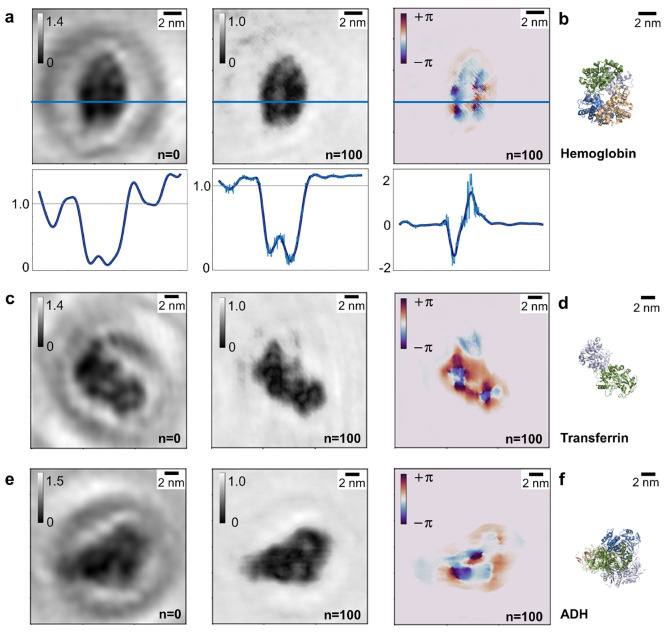
Figure 3.
Amplitude and phase reconstructions of protein holograms. (a) Left to right: one-step amplitude reconstruction, iterated amplitude reconstruction after 100 iterations, and phase reconstruction after 100 iterations of a hemoglobin molecule and cross sections along the blue lines indicated in the images. The cross sections (light blue) have been smoothed with a Savitzky–Golay filter (dark blue) for enhanced clarity. (b) Crystallographic model of a hemoglobin molecule (PDB: 1FSX(39)) in an orientation matching the one observed in (a). (c) Left to right: one-step amplitude reconstruction, iterated amplitude reconstruction after 100 iterations, and phase reconstruction after 100 iterations of a transferrin molecule. (d) Crystallographic model of a transferrin molecule (PDB: 1JNF(40)) in an orientation matching the one observed in (c). (e) Left to right: one-step amplitude reconstruction, iterated amplitude reconstruction after 100 iterations and phase reconstruction after 100 iterations of an ADH molecule. (f) Crystallographic model of an ADH molecule (PDB: 7KCQ(41)) in an orientation matching the one observed in (e).

