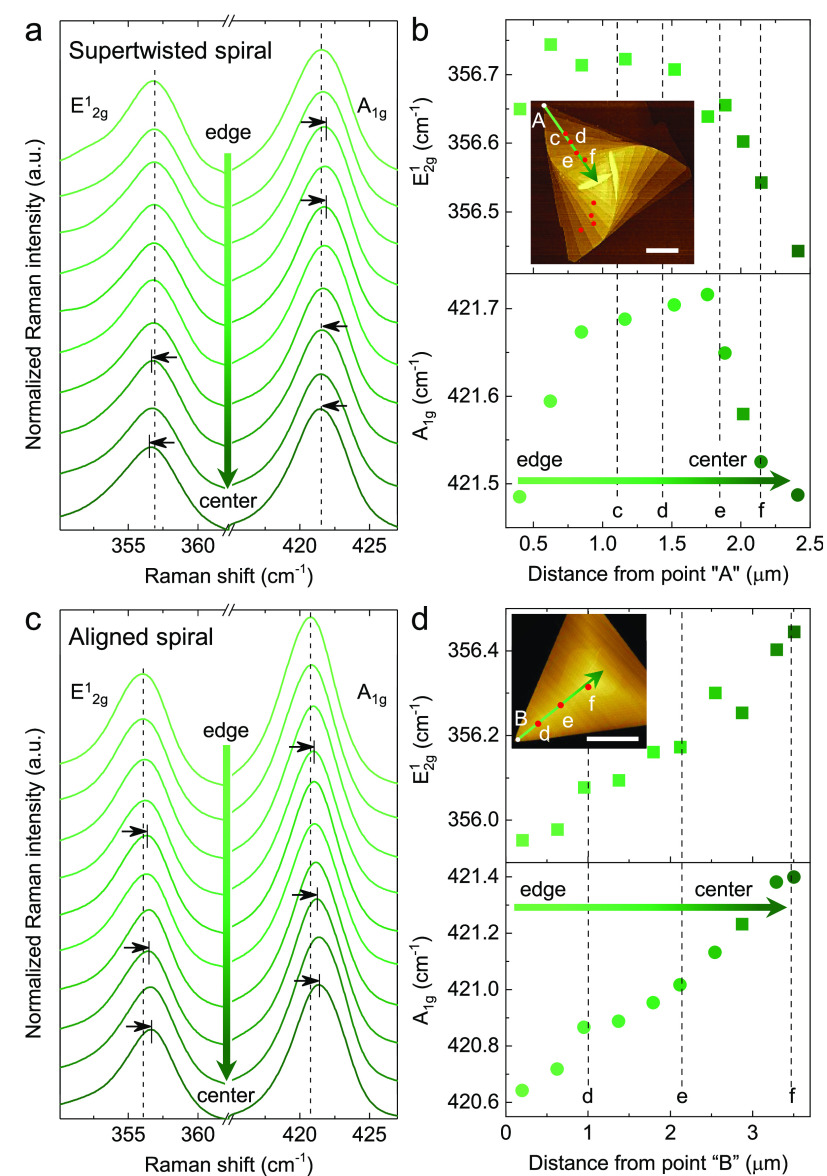
Figure 3.
Probing strain magnitude in supertwisted WS2 spiral. (a) and (c) Raman spectra of a supertwisted and an aligned WS2 spiral along the green arrows in their respective AFM images (the insets in panels (b) and (d)). The dashed lines represent the peaks of the two phonon modes of the sample in the edge region. The black arrows show the redshift or blueshift of Raman peaks. (b) and (d) Individual E12g and A1g mode frequencies of supertwisted and aligned WS2 spiral as a function of the distance from point “A” or “B” labeled in their respective AFM images (insets). The dashed lines indicate the positions where the SHG patterns were recorded in Figures 1 and 2. Scale bars for (b) and (d) are 1 and 2 μm, respectively. When approaching the center of the spiral, frequencies of both E12g and A1g modes monotonically increase in the aligned spiral due to the increase in the number of WS2 layers. However, the frequencies drop near the center of the supertwisted spiral, indicating intrinsic and nonuniform strain in the supertwisted spiral.

