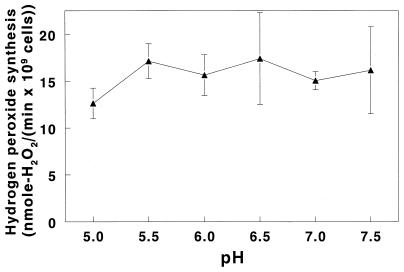
FIG. 3.
Influence of pH on initial rates of hydrogen peroxide formation by S. gordonii CH1. Rates of hydrogen peroxide synthesis were measured as described in Materials and Methods and in the legend to Fig. 1, except that the assay solution was supplemented with 20 mM piperazine and 20 mM bis-Tris buffer. The glucose concentration for all determinations was 1 mM. Results are means ± SD of three rate determinations at each pH.

