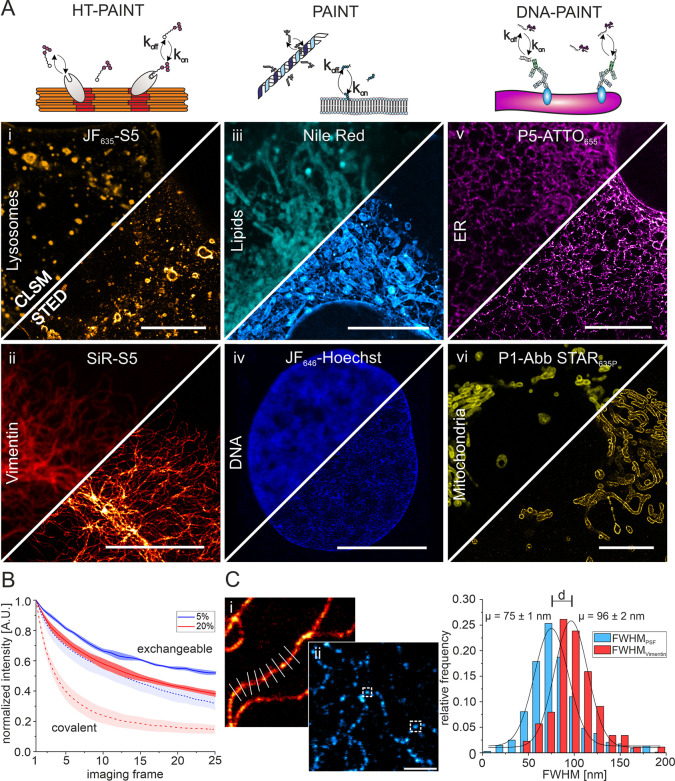
Figure 1.
Exchangeable fluorescent labels for CLSM and STED microscopy of various cellular structures. (A) Illustration of the principle of transient ligand binding to target structures in HT-PAINT, PAINT, and DNA-PAINT (upper panel). Lower panels show CLSM and STED images using nonorthogonal xHTLs (LamP1-HT7 (i), 300 nM JF635-S5, gold; vimentin-HT7 (ii), 300 nM SiR-S5, red hot), PAINT labels (500 nM Nile Red (iii), cyan hot; 300 nM JF646-Hoechst (iv), blue), and DNA-PAINT labels (KDEL-antibody (v), 300 nM P5-ATTO655, magenta hot; TOM20-antibody (vi), 300 nM P1-Abb STAR635P, yellow). All scale bars in (i–vi) are 10 μm. (B) Comparison of fluorescence signal versus time recorded in CLSM mode for vimentin structures in U2OS cells using exchangeable (JF635-S5) or covalent HaloTag ligands (JF635-HTL) at different laser intensities (Ncells = 3–5). (C) Quantification of the resolution in STED images. The optical resolution was determined from the intensity profile perpendicular to continuous vimentin-HT7 structures ((i), 500 nM SiR-S4, red hot) or the full-width at half-maximum (fwhm) of individual vimentin-HT7 spots ((ii), 100 nM JF635-S5, cyan hot). Scale bar is 1 μm. Shown is the relative frequency distribution of the determined fwhm of individual spots (light blue, n = 691) and intensity profiles (red, n = 88).

