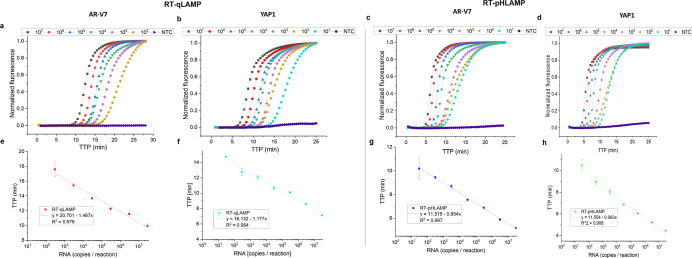
Figure 2.
(a–d) Sigmoidal amplification curves of RT-qLAMP and RT-pHLAMP assays detecting AR-V7 and YAP1 synthetic RNA. Synthetic RNA concentrations varied from 3 × 10⁷ to 3 × 10² copies per reaction for the AR-V7 RT-qLAMP reaction and 3 × 10⁷ to 3 × 101 copies per reaction for each RT-pHLAMP reaction and the YAP1 RT-qLAMP reaction. Data are averaged across two experiments. (a) Amplification curve of the RT-qLAMP assay detecting synthetic AR-V7 RNA. (b) Amplification curve of the RT-qLAMP assay detecting synthetic YAP1 RNA. (c) Amplification curve of the RT-pHLAMP assay detecting synthetic AR-V7 RNA. (d) Amplification curve of the RT-pHLAMP assay detecting synthetic YAP1 RNA. (e–h) Standard curves of RT-qLAMP and RT-pHLAMP detection of synthetic AR-V7 and YAP1 RNA at varying concentrations. These graphs include linear regressions, the coefficient of determinations of each assay, and error bars displaying one standard deviation. (e) Standard curve of the RT-qLAMP assay detecting synthetic AR-V7 RNA. (f) Standard curve of the RT-qLAMP assay detecting synthetic YAP1 RNA. (g) Standard curve of the RT-pHLAMP assay detecting synthetic AR-V7 RNA. (h) Standard curve of the RT-pHLAMP assay detecting synthetic YAP1 RNA.

