Figure 4.
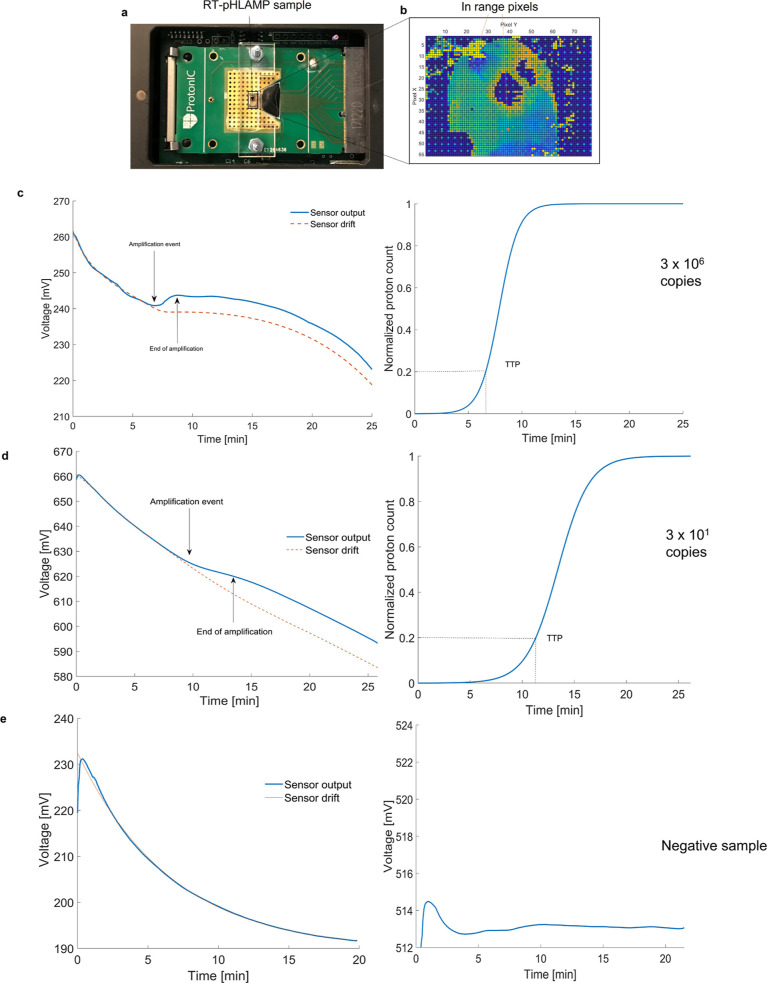
Illustration of RT-pHLAMP implementation onto the LoC platform. (a) ISFET microchip setup with an acrylic manifold and RT-pHLAMP sample loaded onto the microchip. (b) Array of the ISFET microchip once the experiment was initiated. In range pixels are shown in green/light blue. Dark blue and red indicate pixels that are out of range for pH detection. (c) ISFET sensor output graph (left) and sigmoidal-fitted amplification curve (right) of a positive AR-v7 sample on the ISFET microchip (3 × 10⁶ copies per reaction). (d) Detection of 3 × 101 copies of synthetic AR-v7 RNA with the ISFET biosensor. The ISFET biosensor output graph (left) and the amplification curve with sigmoidal fitting (right) are shown here. (e) ISFET sensor output graph (left) and amplification curve (right) of a negative AR-v7 sample on the ISFET microchip. No sigmoidal fitting was performed for this experiment on account of the negative signal.

