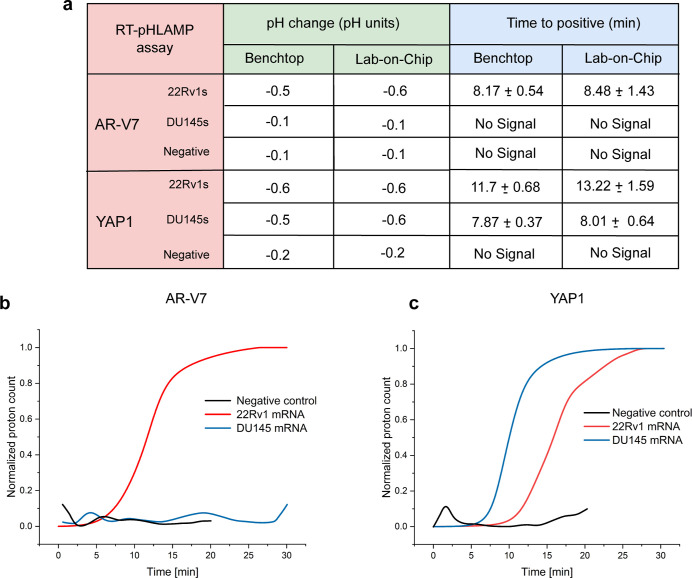
Figure 5.
(a) TTP and pH change values of the benchtop and LoC RT-pHLAMP assays. Benchtop assays were terminated after 35 min, LoC positives were terminated after 30 min and LoC negatives after 20 min. (b) Sigmoidal-fitted averages of AR-V7 mRNA in 22Rv1s, DU145s, and negative samples using the RT-pHLAMP assay. Graphs are the average values of triplicate assays. (c) Sigmoidal-fitted averages of YAP1 mRNA in 22Rv1s, DU145s, and negative samples using the RT-pHLAMP assay. Graphs represent the average values of triplicate assays.

