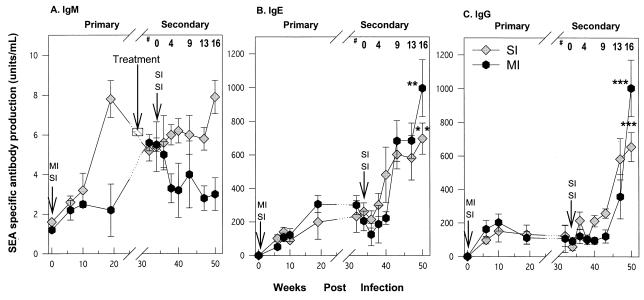
FIG. 6.
Levels of parasite-specific IgM (A), IgE (B), and IgG (C) in serum after S. mansoni infection. Each time point represents the geometric mean ± standard error of the mean for seven animals. Serum antibody titers that are significantly different between corresponding time points of primary and reinfection phases are indicated by single asterisks (P < 0.05), double asterisks (P < 0.01)., and triple asterisks (P < 0.001). #, weeks after reinfection. Arrows show times of infection.

