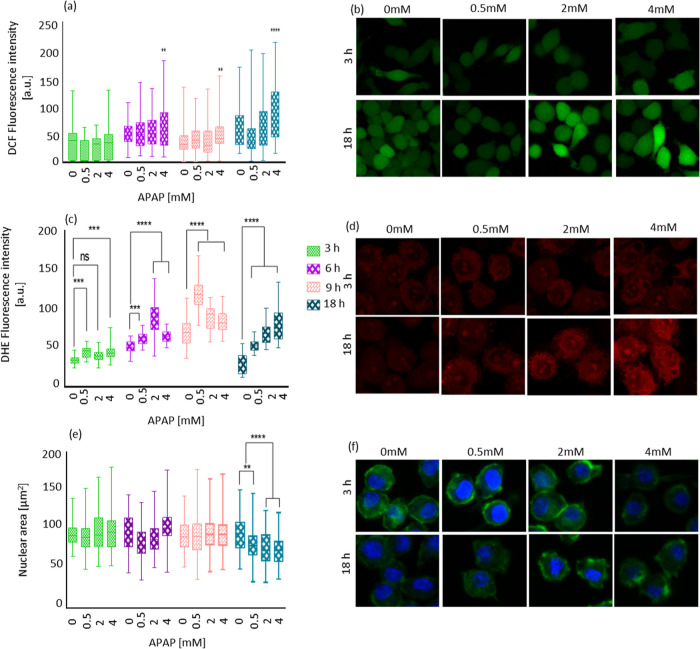
Figure 4.
APAP induced ROS generation and total nuclear area on time points 3, 6, 9, and 18 h treated with 0, 0.5, 2, and 4 mM APAP. (a) DCFH-DA assay shows intracellular ROS generation after different time points of APAP treatment. (b) Representative confocal images from the DCF-stained macrophage J774A.1 cells. (c) Superoxide radical formation measured by the dihydro ethidium (DHE) assay. (d) Confocal images show the fluorescence intensity inside the cell caused by superoxide determined by DHE assay. (e) Total nuclear area. (f) Confocal images showing the reduction in total nucleus area after APAP treatment compared to the control group. Here, nuclei were stained with DAPI shown in blue, and actin fibers were stained with phalloidin-FITC shown in green. Scale bars are 15 μm. The data are shown by separated box and whisker plots with minimum and maximum values. Each experiment was repeated three independent times. Data were analyzed using a two-way ANOVA followed by a Tukey post hoc test. Statistical significance is indicated by *P ≤ 0.05, **P ≤ 0.01, and ****P ≤ 0.0001.

