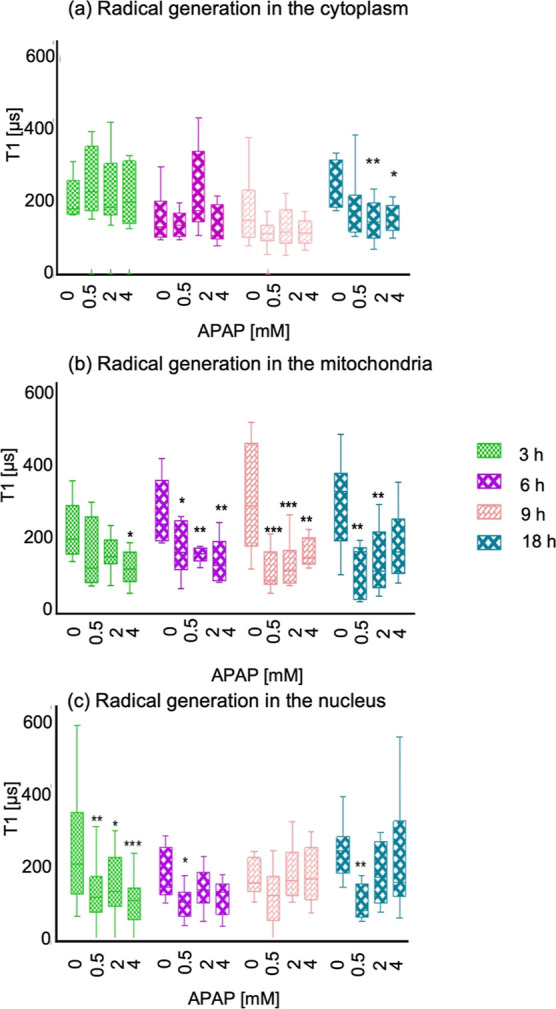
Figure 5.

APAP-induced free radical response measured by relaxometry. (a) T1 relaxation in cells treated with different concentrations 0.5, 2, and 4 mM of APAP and different time points 3, 6, 9, and 18 h measured in the cytosol with FNDs. (b) Measurements on the mitochondrial surface using MIT-FNDs and (c) measurements on the nuclear surface using NLS-FNDs under the same conditions. The data are shown by separated box and whisker plots with minimum and maximum values. Each experiment was repeated three independent times. Data were analyzed using two-way ANOVA followed by Tukey post hoc test. Statistical significance is indicated by *P ≤ 0.05, **P ≤ 0.01, and ***P ≤ 0.001.
