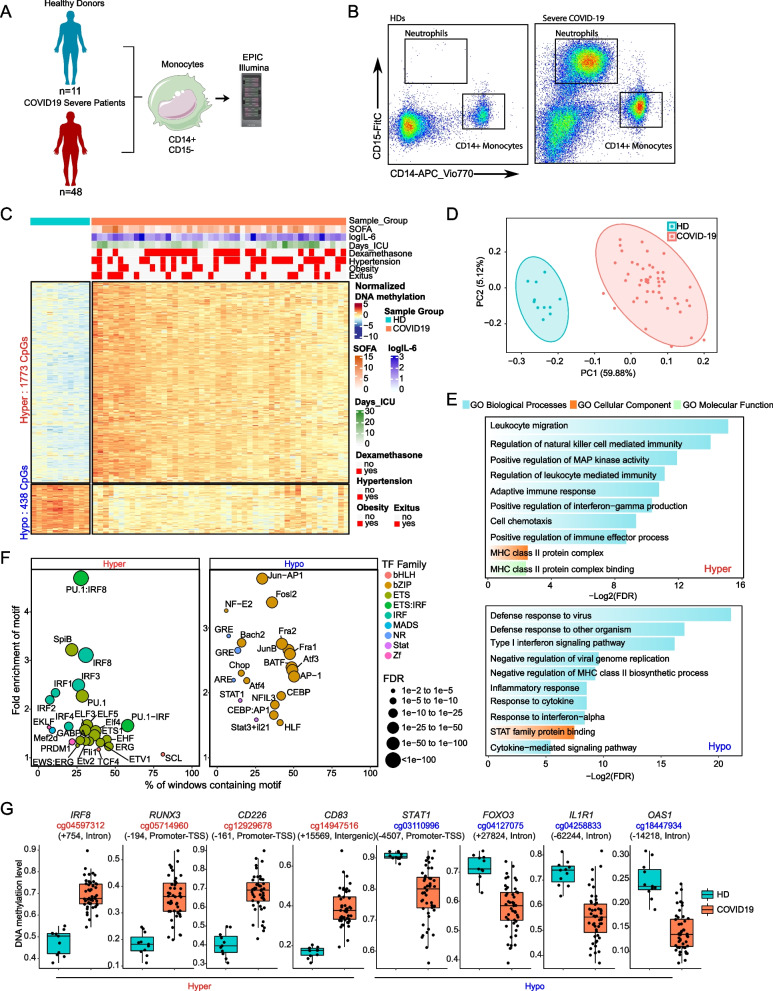
Fig. 1.
Analysis of DNA methylation in blood monocytes of severe COVID-19 patients. A Scheme depicting the cohort and workflow for monocyte purification of severe COVID-19 patients and controls and DNA methylation analysis. B Representative flow cytometry profile, indicating sorting gates used to purify monocytes from HD and COVID-19 patients’ peripheral blood. C Scaled DNA methylation (z-score) heatmap of differentially methylated positions (DMPs) between HDs (blue bar above) and COVID-19 patients (red bar above). Significant DMPs were obtained by applying a filter of FDR > 0.05 and a differential of beta value (Δß) > 0.15. A scale is shown on the right, in which blue and red indicate lower and higher levels of methylation, respectively. Clinical and treatment data of COVID-19 patients are represented above the heatmap. SOFA, IL-6 level, and days in the ICU scales are shown on the right of the panel D Principal component analysis (PCA) of the DMPs. HDs and severe COVID-19 patients are illustrated as blue and red dots, respectively. E Gene ontology of hypermethylated and hypomethylated DMPs. Selected significant functional categories (FDR < 0.05) are shown. F Bubble plot of TF motifs enriched on hypermethylated and hypomethylated DMPs. Bubbles are colored according to their TF family; their size corresponds to the FDR rank. G Box plot of individual DNA methylation values of CpG from hypermethylated and hypomethylated clusters (b-values), with the name of the closest gene and the position relative to the transcription start site

