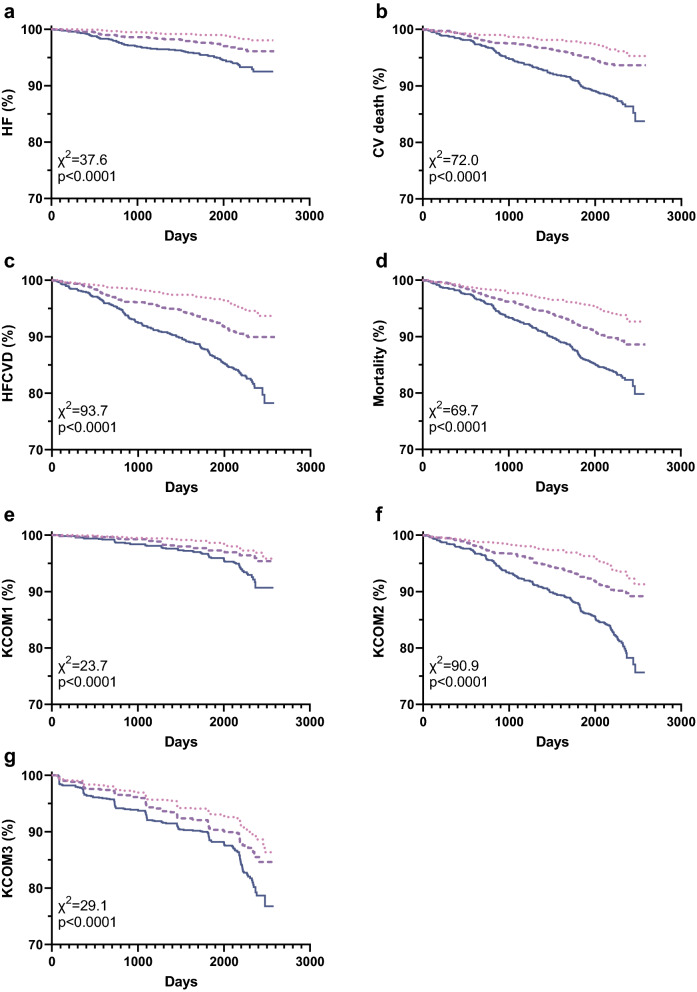
Fig. 2.
Association of P-ETP with outcome. Patients were stratified based on baseline P-ETP into tertiles and Kaplan–Meier curves were plotted for each tertile. Risk was assessed with reference to tertile 1 for (a) heart failure (HF), (b) CV death, (c) the composite of HF and CV death, (d) all-cause mortality, (e) the kidney composite endpoint 1 (KCOM1; 40% decrease in eGFR, kidney death, or ESKD), (f) -2 (KCOM2; KCOM1 and CVD), and (g) -3 (KCOM3; KCOM1 and conversion to severely increased albuminuria). Tertile 1,  ; Tertile 2,
  ; and Tertile 3,

