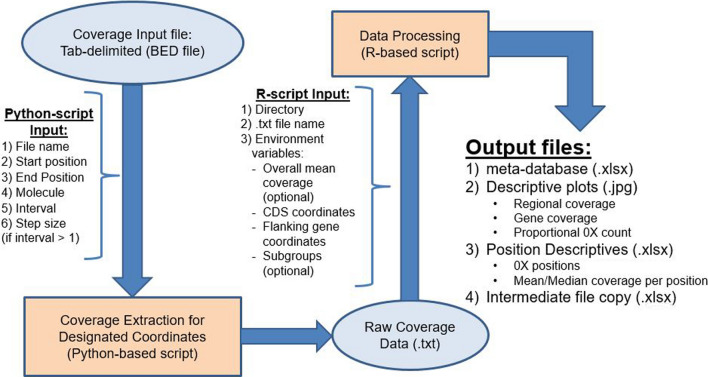
Fig. 1.
GC3 framework. GC3 extracts read coverage information and processes it into a metric database and descriptive tables/figures. Ovals denote initial/intermediate input(s). Orange rectangles denote scripts for data processing. User input parameters are needed at two junctions in the process and are listed (required and optional). (1) Python script extracts coverage data either using a “sliding window”, or coverage at every locus between user-defined start and end coordinates. Overall mean coverage between start and end coordinates can be extracted using a separate function. Output files from the python script (i.e. intermediate output) become the input into the R script, which generates metrics and relevant tables/figures. (2) User input into the R-script is required to define path (directory) to intermediate output as well as the file name, target gene coordinates, intron coordinates (if necessary), coordinates of regions of interest (e.g. flanking genes), and definition of subgroups (optional). Output from R script is Excel versions of intermediate outputs, metrics database, position descriptive database, and relevant figures

