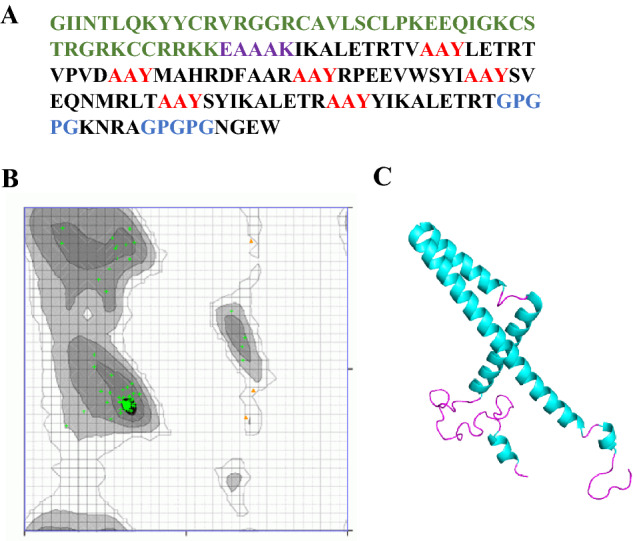
Fig. 7.

The 3D structure of the MEV structure prediction and validation: A epitopes are shown in black color in the MEV construct. The adjuvant sequence is shown in green color, EAAAK linker sequence is shown in purple color, the AAY linkers are shown in red color, and the GPGPG linkers are shown in blue colors; B identification of favorable amino acid residues using Ramachandran plot analysis; C MEV refined conformation (alpha-helix are in cyan color, and loops are shown in pink color)
