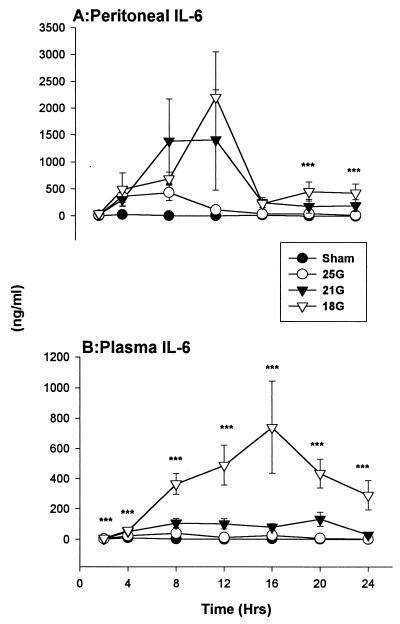
FIG. 6.
IL-6. There were elevated levels of IL-6 within the peritoneum (A) and in the circulation (B) (see also Table 1) in the 21G- and 18G-treated CLP models. ∗∗∗, P < 0.05 for 18G- sham-treated groups. The SEM may be smaller than the symbol. Values are expressed as means ± SEM for 6 to 10 mice.

