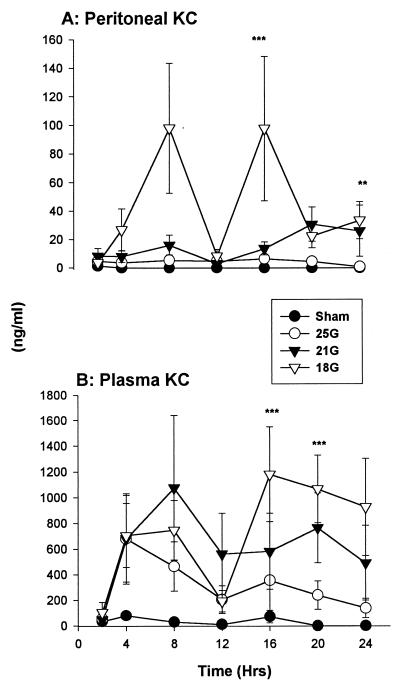
FIG. 8.
KC. (A) There were elevated KC levels within the peritoneum in the 18G-treated CLP model. (B) All mice that underwent CLP had elevations in the circulation regardless of puncture size. KC levels in plasma are substantially higher than those in the peritoneum. Values are expressed as means ± SEM for 6 to 10 mice. ∗∗, P < 0.05 for 21G versus sham treatment groups; ∗∗∗, P < 0.05 for 18G versus sham treatment groups. The SEM may be smaller than the symbol.

