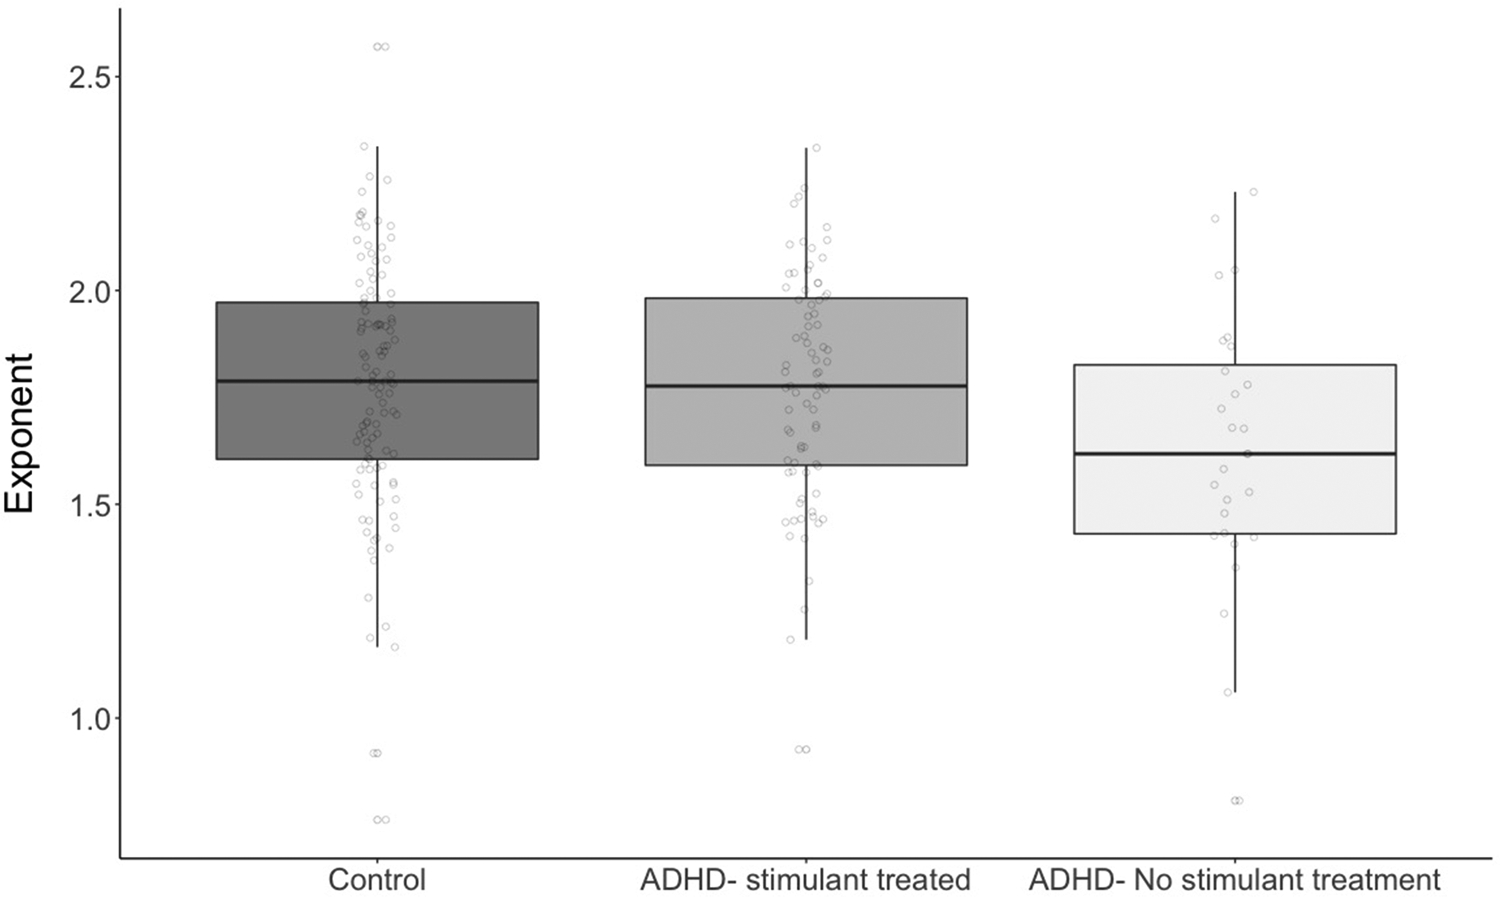
Figure 4.

shows group differences in aperiodic exponent estimates for typically-developing children, stimulant-naïve children with ADHD, and children with ADHD and a lifetime history of treatment with stimulants. Children with ADHD who had not received stimulant treatment had smaller aperiodic exponents (flatter spectral slope) than typically-developing children; children who had been treated with stimulants did not differ from typically-developing children.
