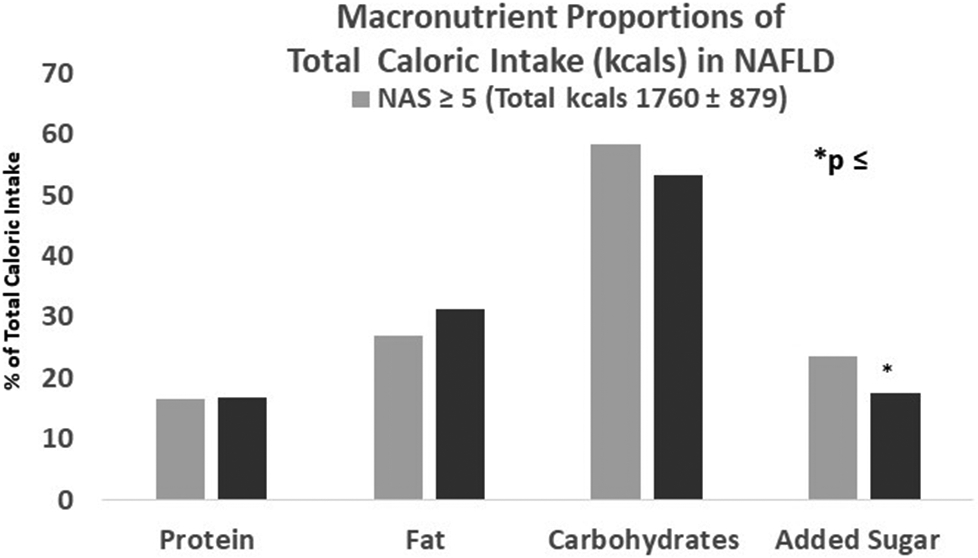
Figure 1a.

Adolescents with NAFLD, with (NAS >/= 5) and without (NAS </=4) NASH, have similar total caloric intake, as well as the proportion of calories derived from protein, fat and carbohydrates. Adolescents with NASH, however, consumed a greater proportion of their total calories as added sugar compared to those without NASH (p=0.05).
