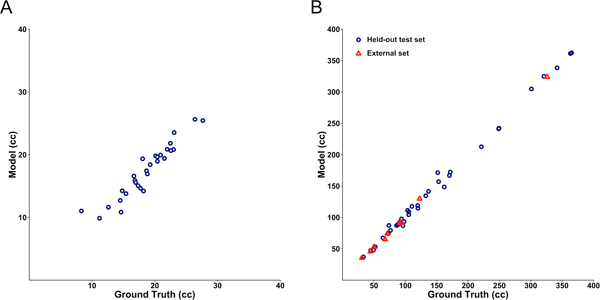
Figure 3.
Correlation between the DL model and manually derived ventricular volume for control (A) (r2 = 0.90) and hydrocephalus (B) (r2 = 0.997) T2-weighted MRIs from the held-out test set. Blue circles denote MRIs from the held-out test set. Red triangles denote external MRIs from the fifth instution, not used for model development.

