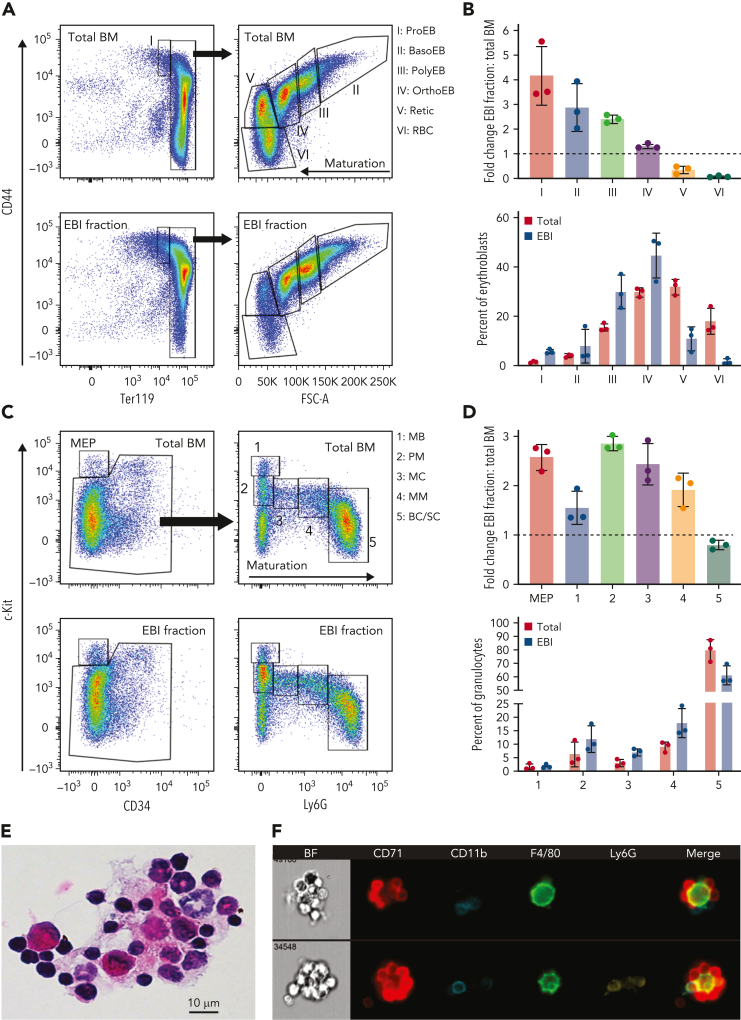
Figure 2.
Immature granulocytes are enriched within the EBI fraction, similarly to erythroblasts, and are present in isolated EBIs. Total unfractionated BM and the EBI fraction, after cell dissociation, were evaluated by flow cytometry for erythroblasts and granulocytic precursors. (A) Representative flow plots showing terminal erythropoiesis populations in total unfractionated BM and the EBI fraction. Populations I to VI correspond to proerythroblasts (ProEB), basophilic (BasoEB), polychromatophilic (PolyEB), and orthochromatic (OrthoEB) erythroblasts, reticulocytes (Retic), and mature red blood cells (RBC), respectively. (B) Top graph: the fold change of each population in the EBI fraction vs the whole BM was calculated in 3 biologic repeats (fold change is shown as mean ± SD). Bottom graph: the percentage of each erythroblast population out of total erythroblasts in the total BM (red bars) and the 3% BSA fraction (blue bars) demonstrates the incremental presence of maturing erythroblast populations in total BM and EBI fraction as expected. (C) Representative flow plots showing terminal granulopoiesis populations in total unfractionated BM and EBI fraction. Populations 1 to 5 contain predominantly myeloblasts (MB), promyelocytes (PM), myelocytes (MC), metamyelocytes (MM), and band and segmented cells (BC/SC), respectively. (D) The fold change of each population in the EBI fraction vs the whole BM was calculated in 3 biologic repeats (fold change is shown as mean ± SD). (E) Hematoxylin and eosin staining of cytospins of the EBI fraction showing macrophages surrounded by erythroblasts and granulocytic precursors. (F) IFC of the EBI fraction showing CD11b+Ly6Gneg immature granulocyte precursors and more mature Ly6G+ granulocyte precursors within erythromyeloblastic islands.

