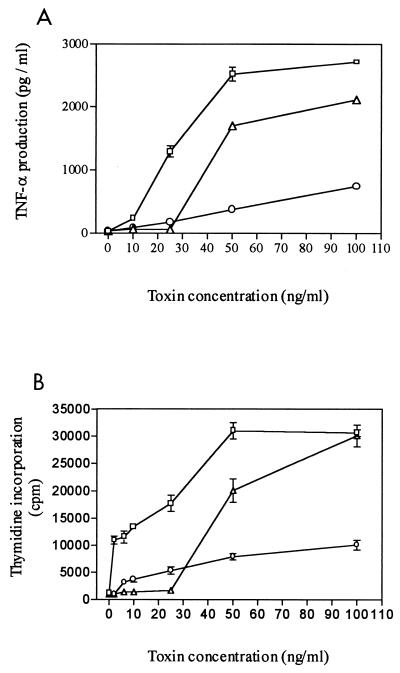
FIG. 3.
Comparison of SEB and SEB mutant proteins F44R and N23F for stimulation of TNF-α production (A) and proliferation (B). Symbols: □, SEB; ▵ and ○, SEB mutants F44R and N23F, respectively. (A) Monocytes and lymphocytes (1:4 ratio) were plated in four replicates and cultured for 20 h in the presence of varying concentrations of toxin. Culture media were collected, and TNF-α production was analyzed in duplicate. Statistical analysis (t test) of significant differences compared to native SEB showed P < 0.001 at the concentrations 25 to 100 μg/ml for mutant protein N23F and at 25 and 50 μg/ml for mutant protein F44R. (B) Incorporation of [3H-methyl]thymidine in mixed culture was determined after exposure to toxin for 72 h. The data are averages of three experiments done in replicates of six. Statistical analysis (t test) of significant differences compared to native SEB showed P < 0.001 at the concentrations 6 to 100 ng/ml for mutant protein N23F and at 6 to 50 ng/ml for mutant protein F44R.

