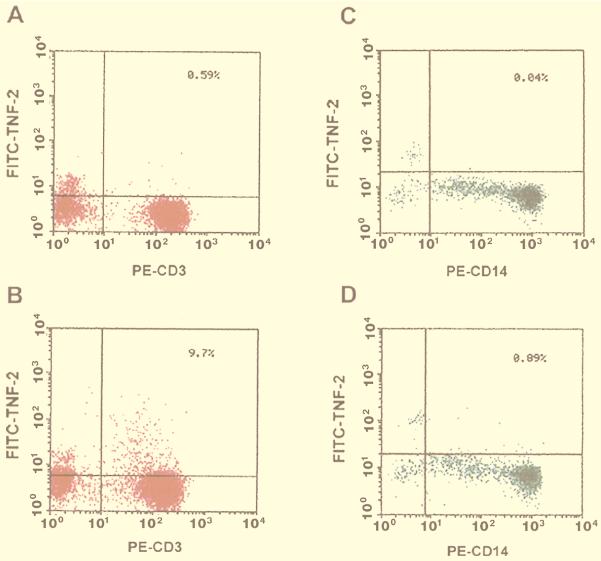
FIG. 4.
FACScan analysis of TNF-α expression in monocytes and lymphocytes. Monocytes and lymphocytes (5 × 10⁵ each) were mixed and incubated for 6 h with 100 ng of SEB per ml in the presence of 2 μM monensin. Samples were fixed and then permeabilized and stained with cell-type-specific antibody and analyzed on a FACScan flow cytometer. Negative controls (A and C) were without SEB. Samples were stained with anti-CD3 or anti-CD14 antisera to identify the following: lymphocytes (A), lymphocytes plus SEB (B), monocytes (C), and monocytes plus SEB (D).

