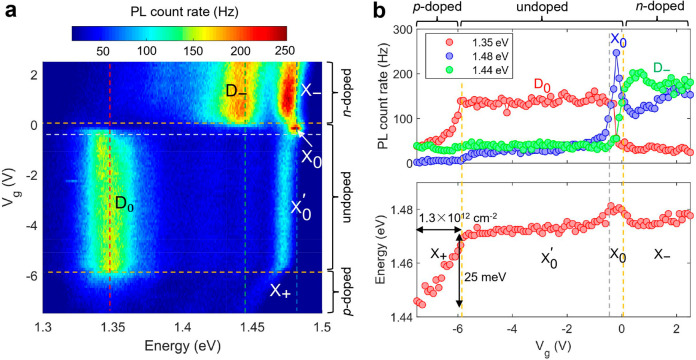
Figure 2.
Charge-tunable excitons in few-layer InSe. (a) PL count rate as a function of the emission energy and gate voltage using P = 50 μW, measured at position A in Figure 1d. The horizontal yellow dashed lines indicate different charging regimes. (b) Upper panel: PL count rate as a function of the gate voltage along the three vertical dashed lines in (a). Red, 1.35 eV; blue, 1.48 eV; green, 1.44 eV. The plateau in the red and green curve correspond to the D0 and D– emissions, and the peak in the blue curve corresponds to the X0 emissions. Lower panel: peak energy as a function of the gate voltage. The vertical yellow dashed lines indicate different charging regimes. Here, “undoped” means unintentionally doped.

