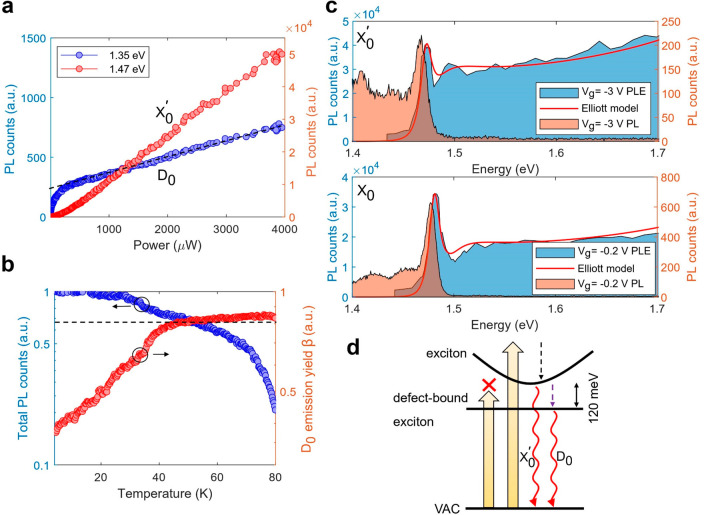
Figure 3.
Defect-bound exciton and photoluminescence excitation spectrum. (a) Emission intensity of D0 (blue) and X0′ (red) peaks as a function of the laser power. The black dashed line indicates the linear background originating from the low-energy tail of X0 at high power. (b) Left: (normalized) total PL counts of X0′ and D0 as a function of temperature using P = 50 μW. Right: PL emission yield of D0, defined as β = ID0/(ID0 + IX0′), as a function of temperature. (c) Integrated PL intensity of D0 as a function of excitation energy (PLE spectrum, blue shaded area) and PL intensity as a function of emission energy (orange shaded area) at Vg = −3 V and −0.2 V. The red solid lines are fits using the 2D Elliott model. For X0 (Vg = −0.2 V), the fitting parameters are Eg = 1.493 eV and Eb = 12 meV; for X0 (Vg = −3 V), the fitting parameters are Eg = 1.478 eV and Eb = 6 meV. (d) Schematic of the exciton state and defect-bound exciton state in the quasi-particle picture. Yellow arrows, laser excitation; dashed arrows, relaxations; wave arrows, radiative emissions. VAC stands for the vacuum state.

