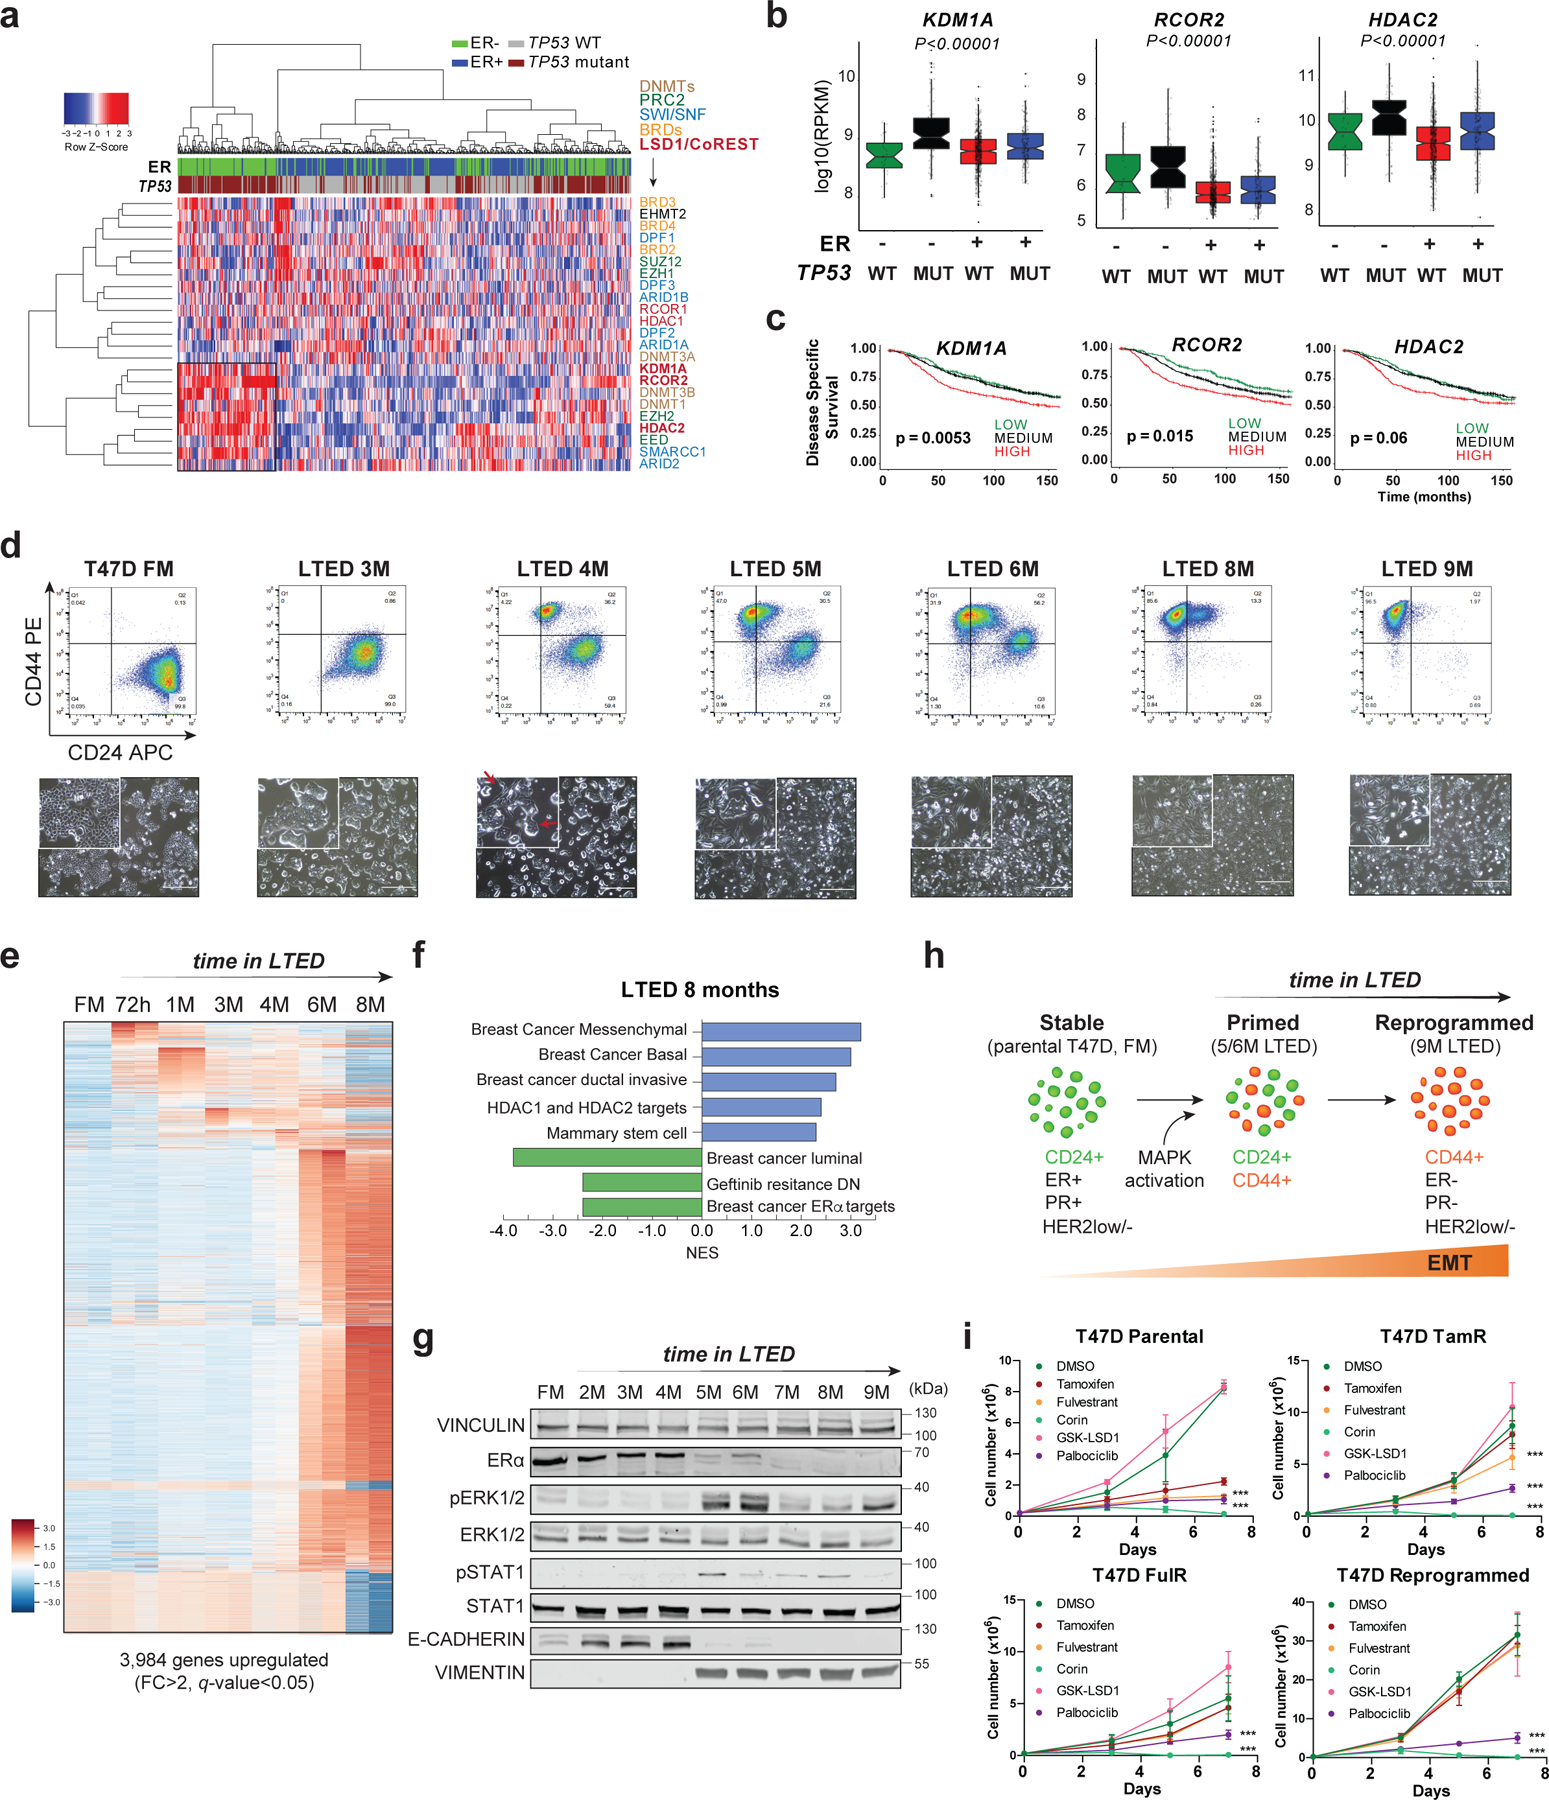
Fig. 1: Endocrine resistant breast cancer cells are sensitive to CoREST inhibition.

a, Expression of selected epigenetic genes in 1,483 patient samples (METABRIC dataset) classified by ER status and TP53 mutation. Unsupervised clustering revealed a cohort of ER-/TP53mut samples with high expression of CoREST subunits (KDM1A, RCOR2, HDAC2) and components of the SWI/SNF complex. b, KDM1A, HDAC2, and RCOR2 mRNA expression in 1,423 breast cancer samples grouped by ER expression and TP53 status. The box plots span from the 25th to 75th percentiles, expression is represented as log10 (RPKM) with the median (midline of box plots) and maximum/minimum (upper and lower bounds of whiskers) values depicted. Significance was determined by a non-parametric Wilcox test (two-sided) and p-values correspond to the comparison between ER-/TP53mut (MUT) with other subgroups. c, Kaplan–Meier survival curves segregated by KDM1A, RCOR2, and HDAC2 expression. Disease-specific survival is significantly diminished for patients (METABRIC dataset) with high KDM1A, RCOR2, and HDAC2. P value was calculated using a log-rank (Mantel–Cox) test. d, Representative FACS of CD24 and CD44 of T47D parental (full media, FM) and 9-month LTED (M, months). CD24 and CD44 expression was monitored every two weeks for over a year (top). Representative images (bottom) of cells from top panel. Red arrows depict cells with mixed epithelial and mesenchymal morphology. n = 3 biological independent replicates. e, Heatmap of significantly upregulated genes (FC > 2, q-value < 0.05) during acquisition of resistance in T47D. f, GSEA of 8M T47D-LTED cells. g, Western blot (WB) of T47D FM and LTED whole cell lysates for the proteins indicated with VINCULIN as a loading control. h, Model of evolution of resistance. We defined 5M and 6M LTED cells as primed and >9M as reprogrammed. EMT, epithelial-to-mesenchymal transition. i, Proliferation of parental, tamoxifen resistant (TamR), fulvestrant resistant (FulR), and LTED T47D treated with 1µm of DMSO (vehicle), tamoxifen, fulvestrant, corin, GSK-LSD1, or palbociclib for 7 days, n = 3 biological independent replicates. Data are presented as mean values + SD (p-value < 0.001, two-way ANOVA). Uncropped images for g are available as source data.
