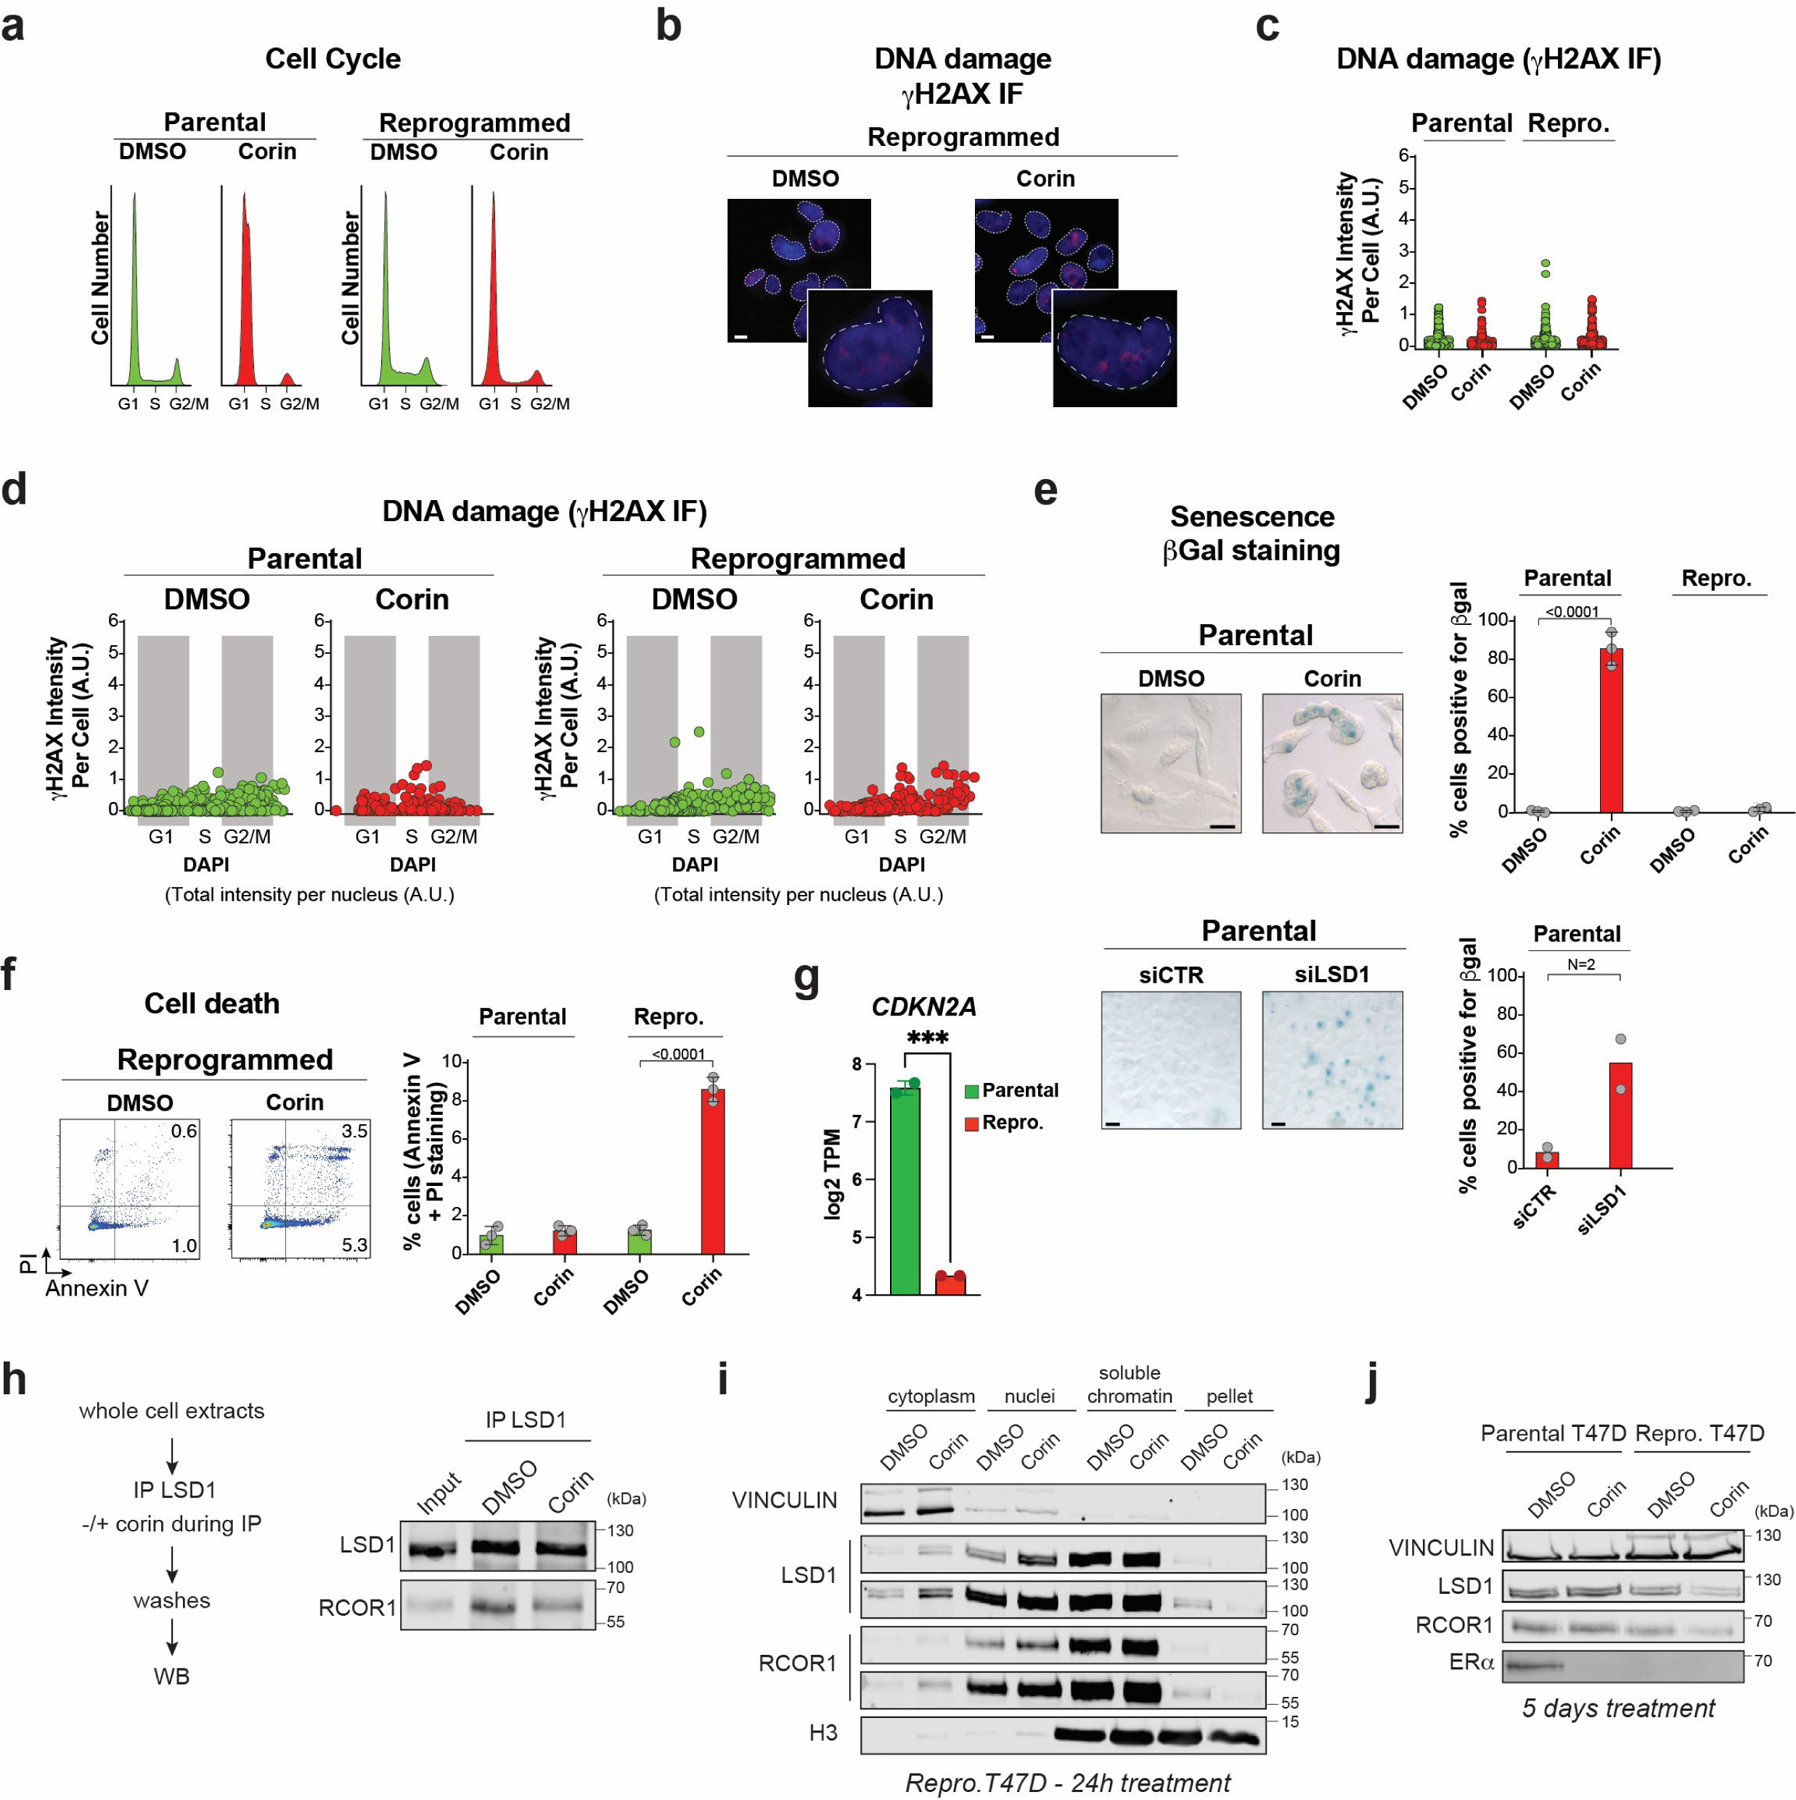
Extended Data Fig. 5. Mechanisms of action following CoREST chemical inhibition.

a-b, Cell cycle analysis (a) and representative γH2AX staining (b) 4 days after treatment with 500nM DMSO or corin. PI, propidium iodide (inset zoom = 4X, scale bar = 5μm). c, Quantification of γH2AX staining intensity from three biologically independent experiments; 200 cells per sample/experiment were analyzed. d, Quantification of the cell cycle distribution of γH2AX defined as the sum of the intensities of γH2AX foci per nucleus post-exposure to DMSO or 500nM corin and stained with DAPI. Data from 3 biologically independent experiments; 200 cells per sample/experiment were analyzed. e-f, Representative images (left) and quantification (right) of ß-galactosidase (e) or PI/Annexin V (f) staining following exposure to DMSO or 500nM corin for 4 days, n = 3 biological independent replicates (two-way ANOVA, scalebar = 10μm), or LSD1 depletion, n = 2 biological independent replicates. g, CDKN2A (encoding p16) log2 TPM values in parental and reprogrammed T47D. (p-value = 0.0007, Two-tailed unpaired t-test), n = 2 biological independent replicates. h, The LSD1-RCOR1 interaction in reprogrammed whole cell lysate is destabilized in the presence of 1µM corin. i, Cellular fractionation of reprogrammed cells treated with 500nM corin for 24h. Two different exposures are shown for LSD1 and RCOR1. j, WB of proteins indicated on the left from parental and reprogrammed cells treated with 1µM of corin for 5 days. Uncropped images are available as source data.
