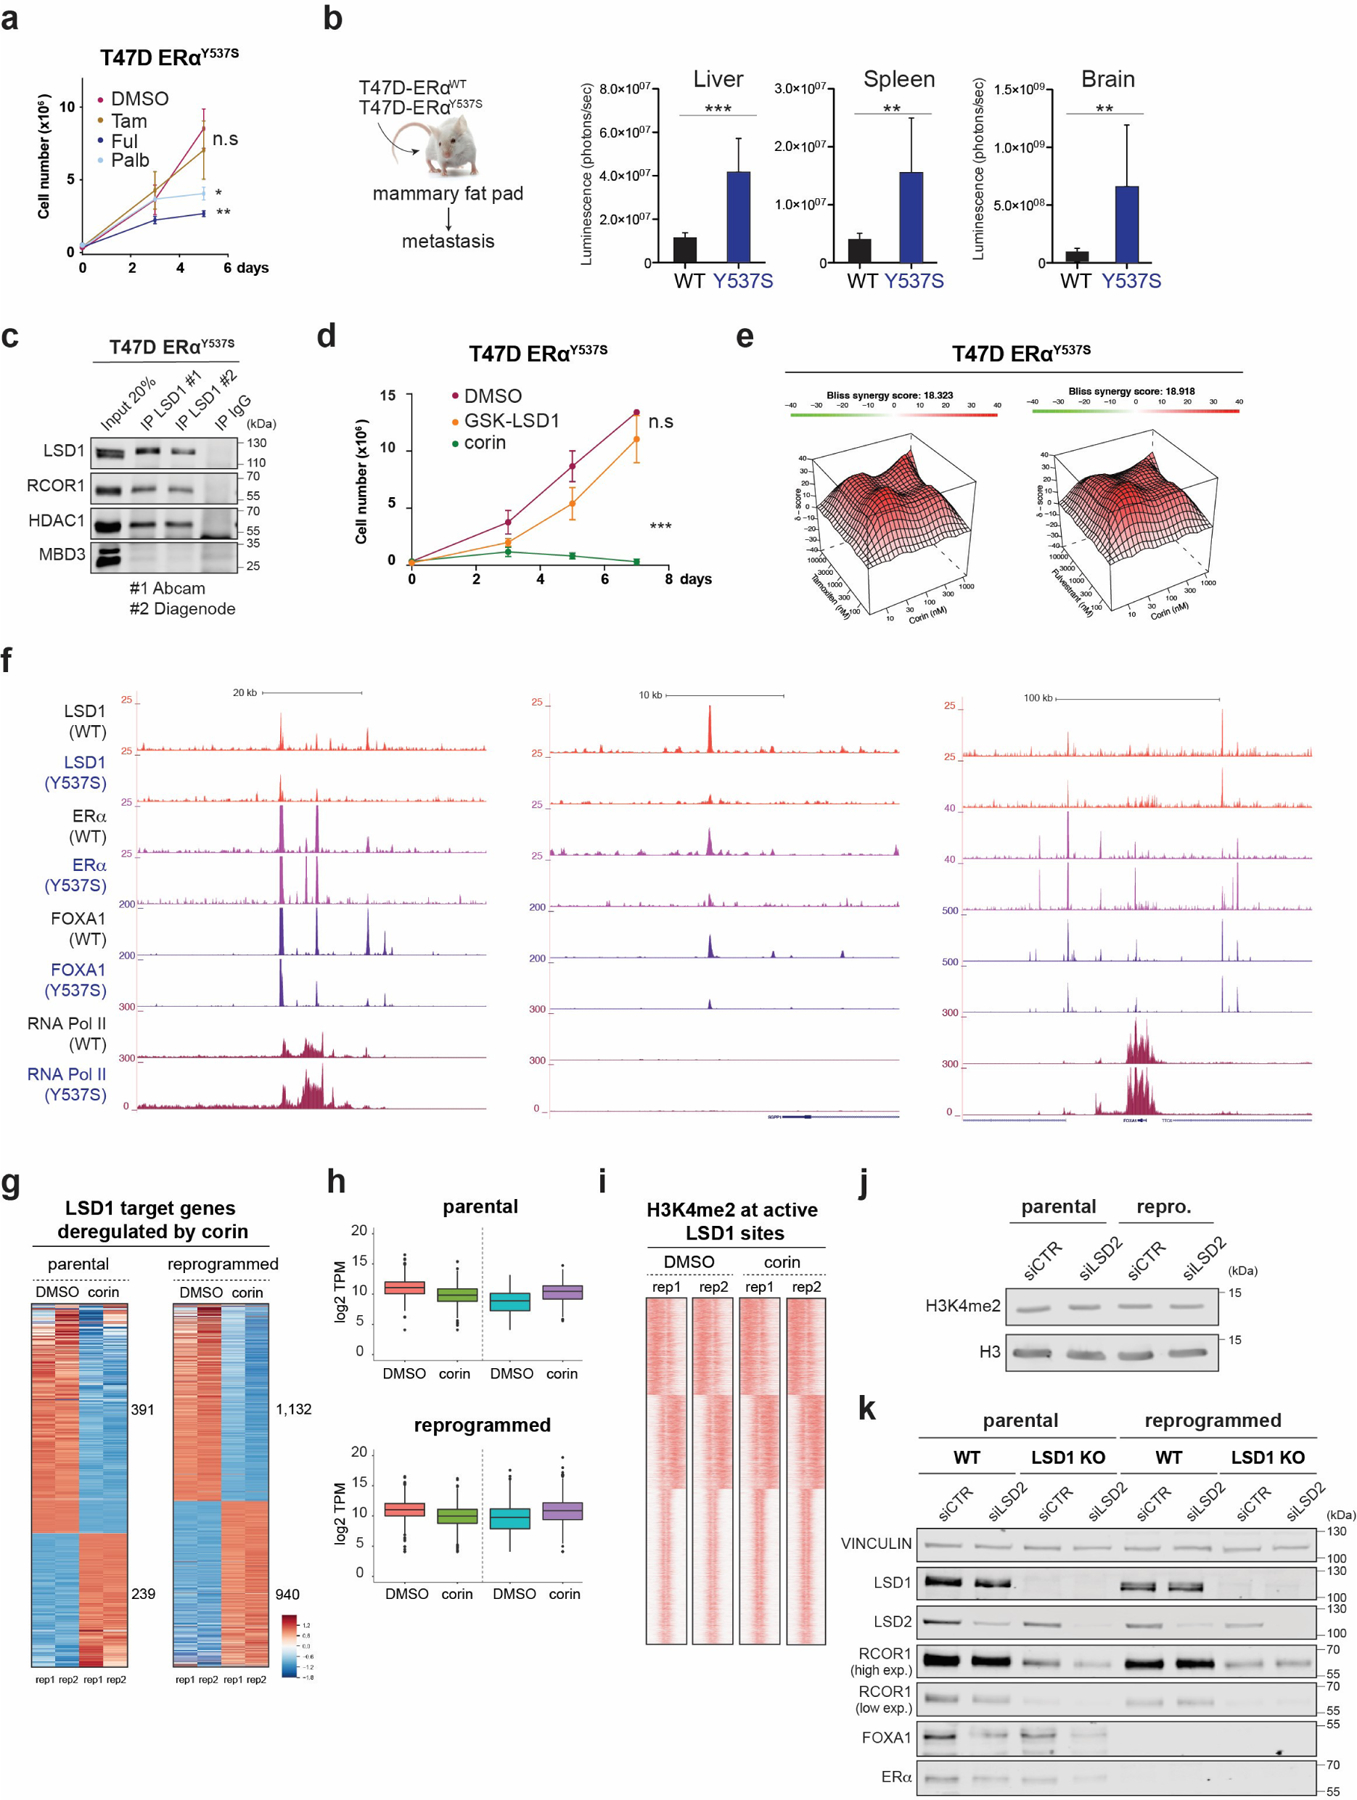
Extended Data Fig. 7. Analysis of T47D-ERαY537S and role of the LSD1 paralog, LSD2.

a, Growth curves of 2 × 10⁵ T47D-ERαY537S cells cultured with 1µM of tamoxifen, fulvestrant, or palbociclib for 5 days, n = 3 biological independent replicates. Data are presented as mean values + SEM, **p-value < 0.01, *p-value < 0.05 (two-way ANOVA). b, Parental and T47D-ERαY537S expressing luciferase were transplanted into the mammary fat pad of NSG mice (n = 8 biological replicates). Data are presented as mean values + SEM. Metastasis was analyzed by IVIS 45 days after orthotopic injection. ***p-value < 0.001, **p-value < 0.01 (two-way ANOVA). c, Endogenous LSD1 immunoprecipitation (IP) in whole cell lysates with CoREST subunits using two antibodies in parental or primed T47D. IgG and MBD3 were used as negative controls. d, Growth curves of 2 × 10⁵ T47D-ERαY537S cells cultured with 1µM of GSK-LSD1 or corin for 7 days, n = 3 biological independent replicates. Data are presented as mean values + SEM, p-value < 0.001 (two-way ANOVA). e, Synergy maps for T47D-ERαY537S cells treated with tamoxifen and corin, or fulvestrant and corin. The 3D synergy matrix was generated with SynergyFinder 2.0. n = 3. f, LSD1, ERα, FOXA1, and RNA Pol II ChIP-seq signal at selected genomic regions in parental and T47D-ERαY537S cells. g-h, RNA-seq heat maps (g) and TPM values (h) of differentially expressed LSD1 target genes in parental and reprogrammed T47D treated with corin (500nM, 72h), n=2 biologically independent samples. The box plots span from the 25th to 75th percentiles, the center line shows the median and whiskers show maximum and minimum values. i, H3K4me2 ChIP-seq signal at LSD1 target genes in parental and reprogrammed cells treated with corin (500nM, 72h). j, H3K4me2 WB of acid-extracted histones from parental and reprogrammed siCTR and siLSD2 cells. k, WB of proteins indicated from parental and reprogrammed WT and LSD1 KO T47D transfected with siCTR or siLSD2. Uncropped images are available as source data
