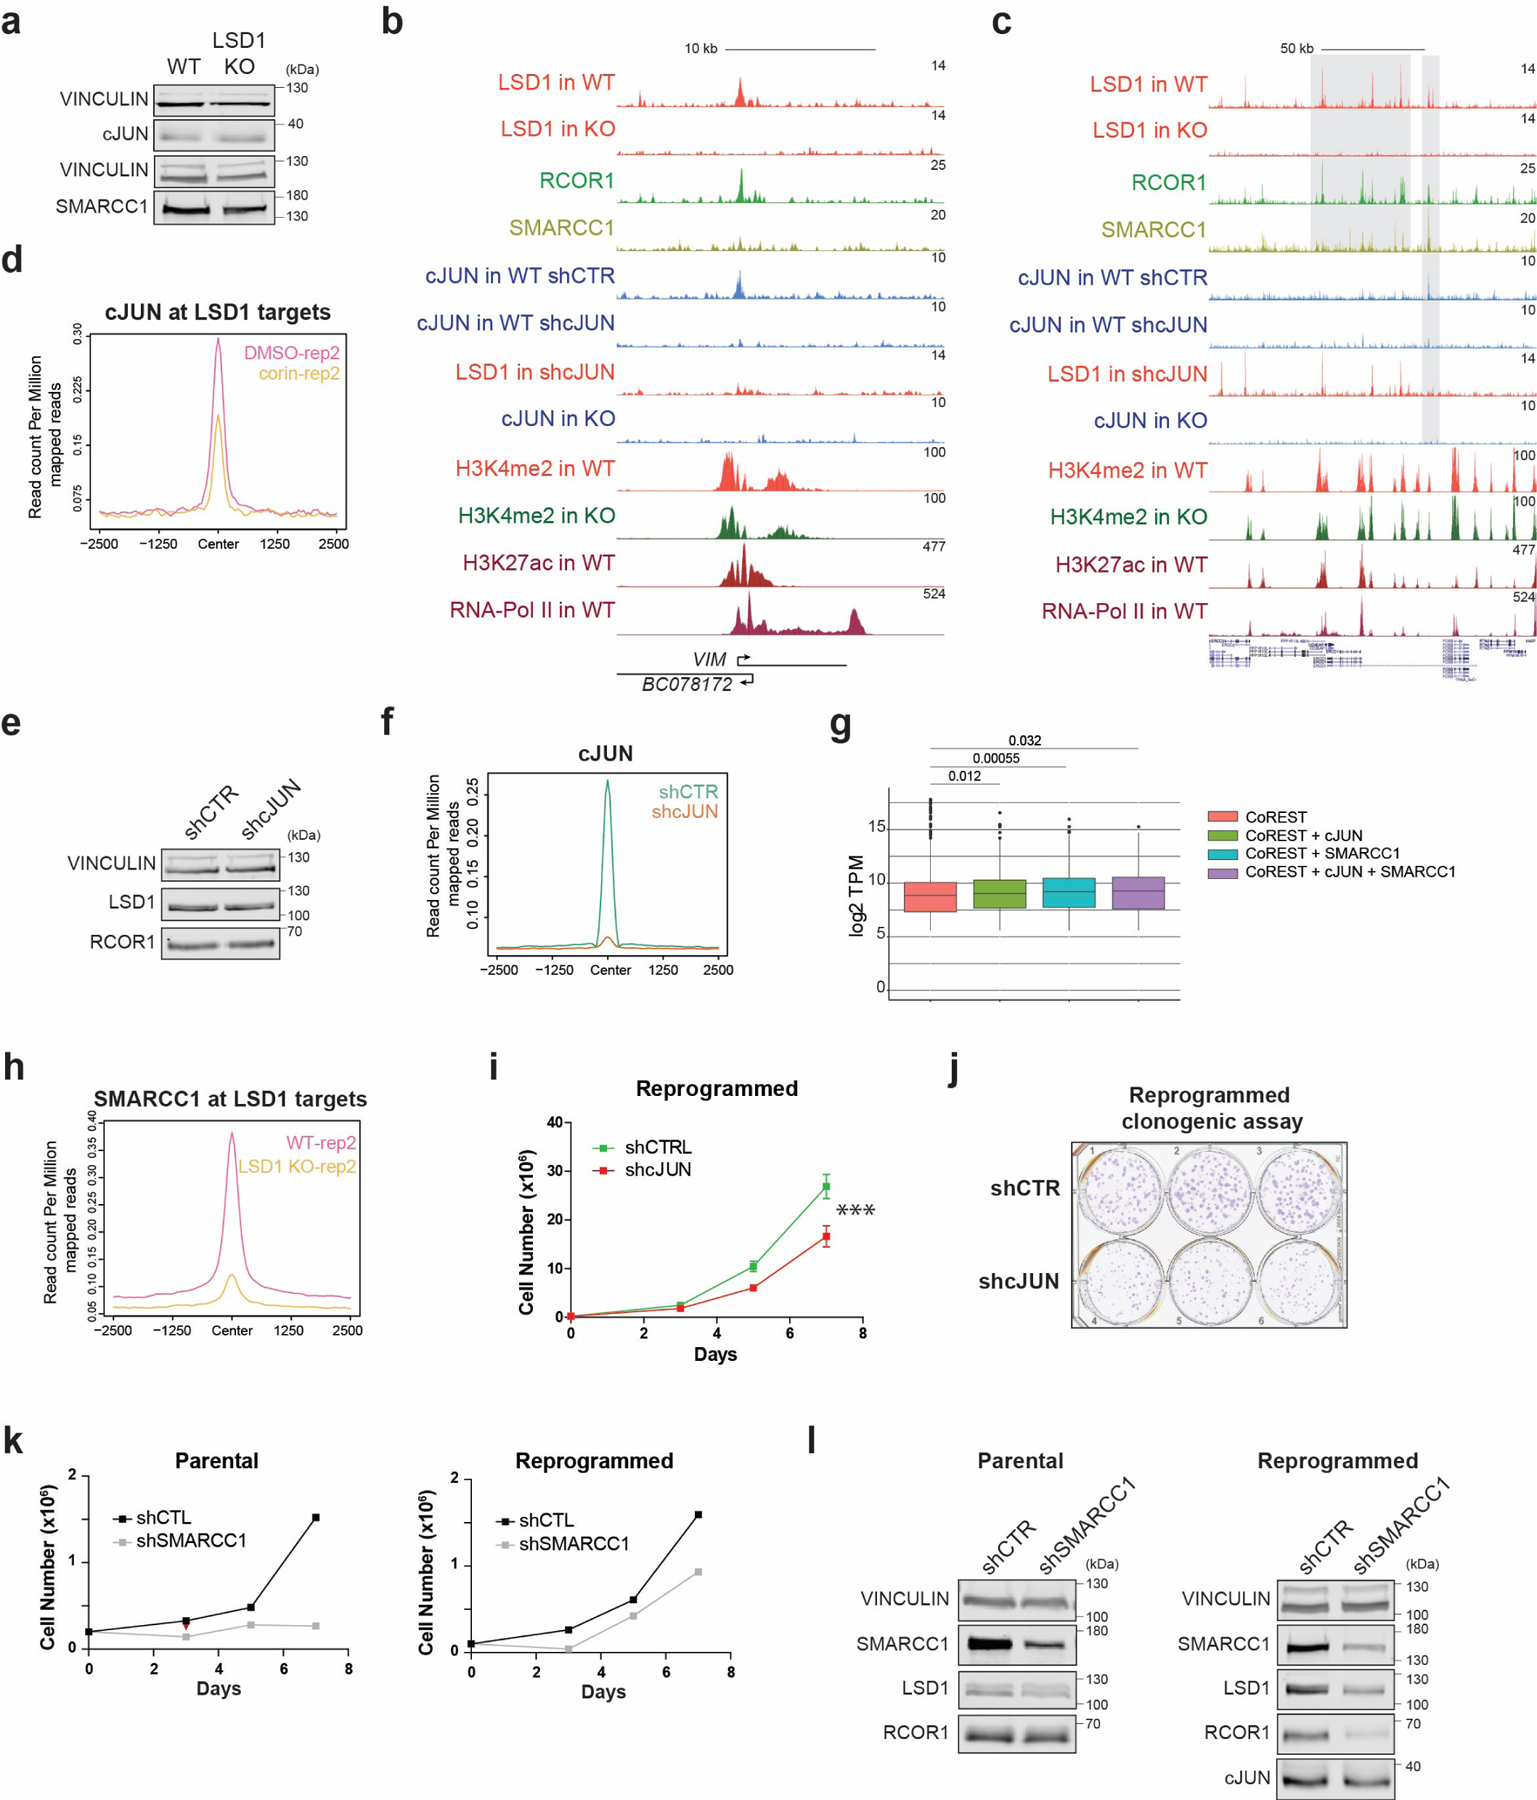
Extended Data Fig. 8. CoREST genomic occupancy and role in cJUN and SMARCC1 chromatin recruitment during reprogramming.

a, cJUN and SMARCC1 WB in reprogrammed control and LSD1 KO T47D. b-c, ChIP-seq signal of factors indicated in reprogrammed WT, LSD1 KO, shCTR and shcJUN T47D at selected regions. d, Second biological replicate of cJUN ChIP-seq in reprogrammed T47D treated with 500nM corin for 72h. e, LSD1 WB in reprogrammed shCTR and shcJUN T47D. f, cJUN ChIP-seq in shCTR and shcJUN reprogrammed cells. g, TPM values of genes identified in each co-occupancy profile (significance determined by the Mann-Whitney test, two-sided), n=2 biologically independent samples. The box plots span from the 25th to 75th percentiles, the center line shows the median and whiskers show maximum and minimum values and statistical significance determined by the Mann-Whitney test). h, Second biological replicate of SMARRC1 ChIP-seq signal in reprogrammed WT and LSD1 T47D. i-j, Proliferation (i) and survival (j) of shCTR and shcJUN reprogrammed T47D. n = 3 independent transductions. Data are presented as mean values + SEM, p-value < 0.001 (two-way ANOVA). k, Proliferation of shCTR and shSMARCC1 parental and reprogrammed T47D, n = 2 biologically independent experiments. l, SMARCC1, LSD1, RCOR1, and cJUN WB in shCTR and shSMARCC1 parental and reprogrammed T47D. Uncropped images are available as source data.
