
Extended Data Fig. 10. Characterization of primed, CD24+, and CD44+ primed cells in vivo and proliferation defects of LSD1 depletion in TNBC.
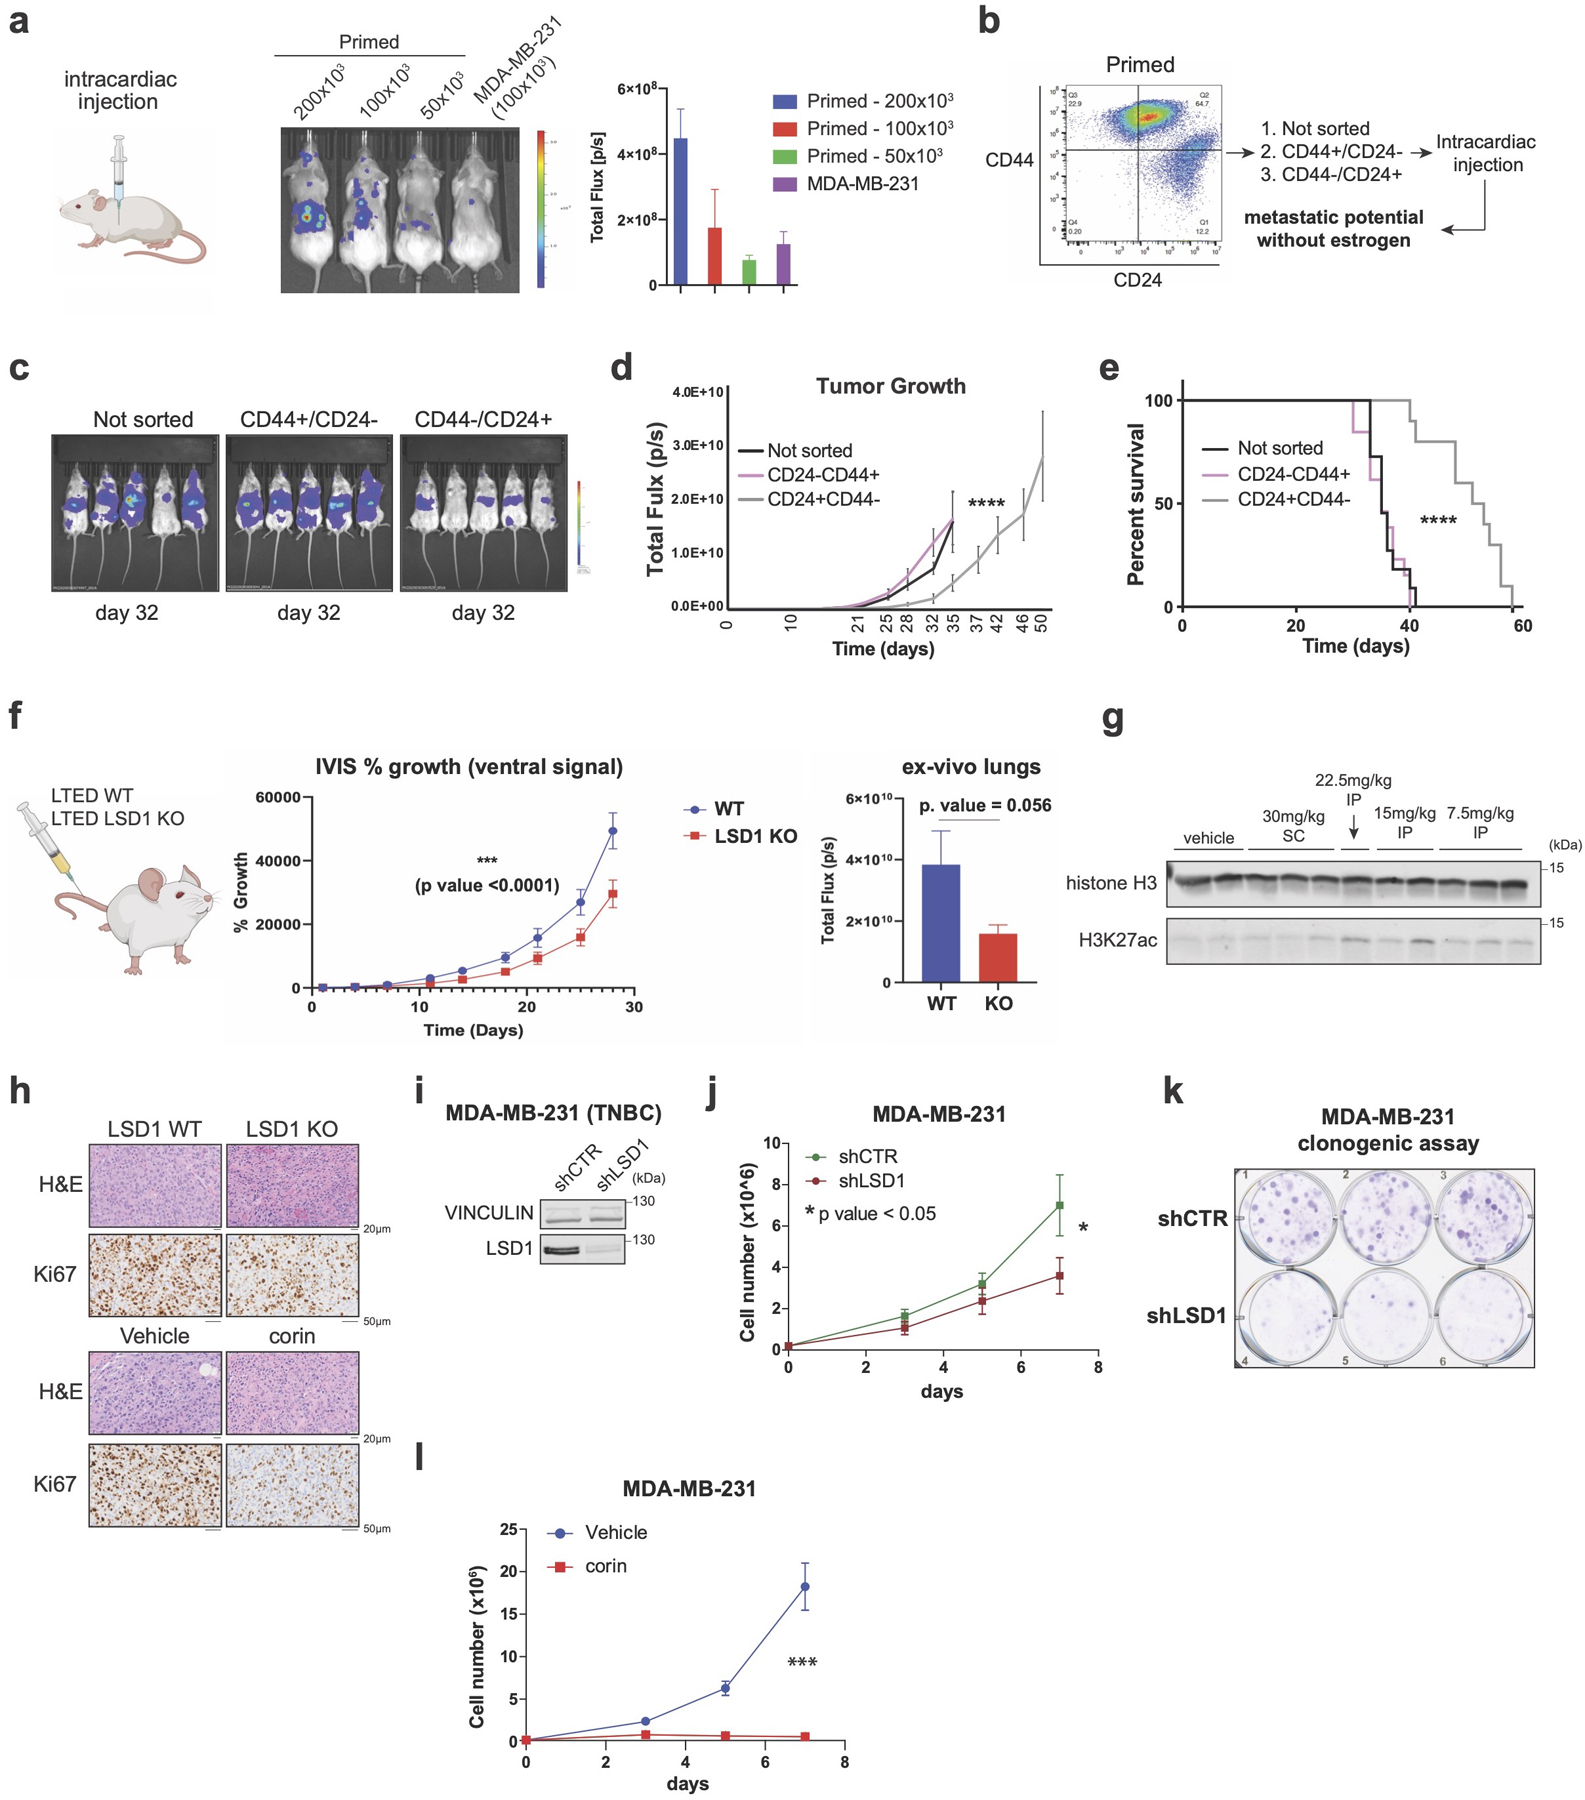
a, Schematic (left) and representative IVIS images of mice (right) injected with serial dilutions of primed T47D and 1×10⁵ MDA-MB-231 (positive control, n = 3/group, data presented as mean values + SEM). b-c, FACS (b) and representative IVIS images at day 32 post-intracardial injection (c) of sorted CD24+ and CD44+ primed T47D two weeks after sorting without estrogen supplementation (n = 5/group). d-e, Tumor size quantification (d) (****p-value < 0.0001, data presented as mean values + SEM) and survival of mice (e) (**** p-value < 0.0001, Log-rank [Mantel-Cox test]). f, Metastasis quantification from WT and LSD1 KO reprogrammed T47D. *** (p-value < 0.0001, Two-way RM ANOVA). 50,000 cells were injected in the tail vain (n = 10 /group, ). g, WB of H3K27ac from liver extracts of mice treated with increasing concentrations of corin. SC, subcutaneous. IP, intraperitoneal. Histone H3 was used as a loading control. h, Representative hematoxylin and eosin (H&E) and Ki67 staining in WT LSD1 or KO (top) and corin treated tumors (bottom). i, LSD1 WB from total extracts of shCTR and shLSD1 MDA-MB-231. j, Effect of LSD1 knockdown on MDA-MB-231 proliferation (p-value =0.0255, unpaired t-test), n=3 independent infections and experiments, data presented as mean values + SEM. k, Clonogenic assay of shCTR and shLSD1 MDA-MB-231 performed in three biological and three technical replicates. l, Proliferation of MDA-MB-231 treated with 1µM corin for 7 days, n = 3 biological independent experiments. Data presented as mean values + SEM, p-value < 0.001 (two-way ANOVA). Uncropped images are available as source data.