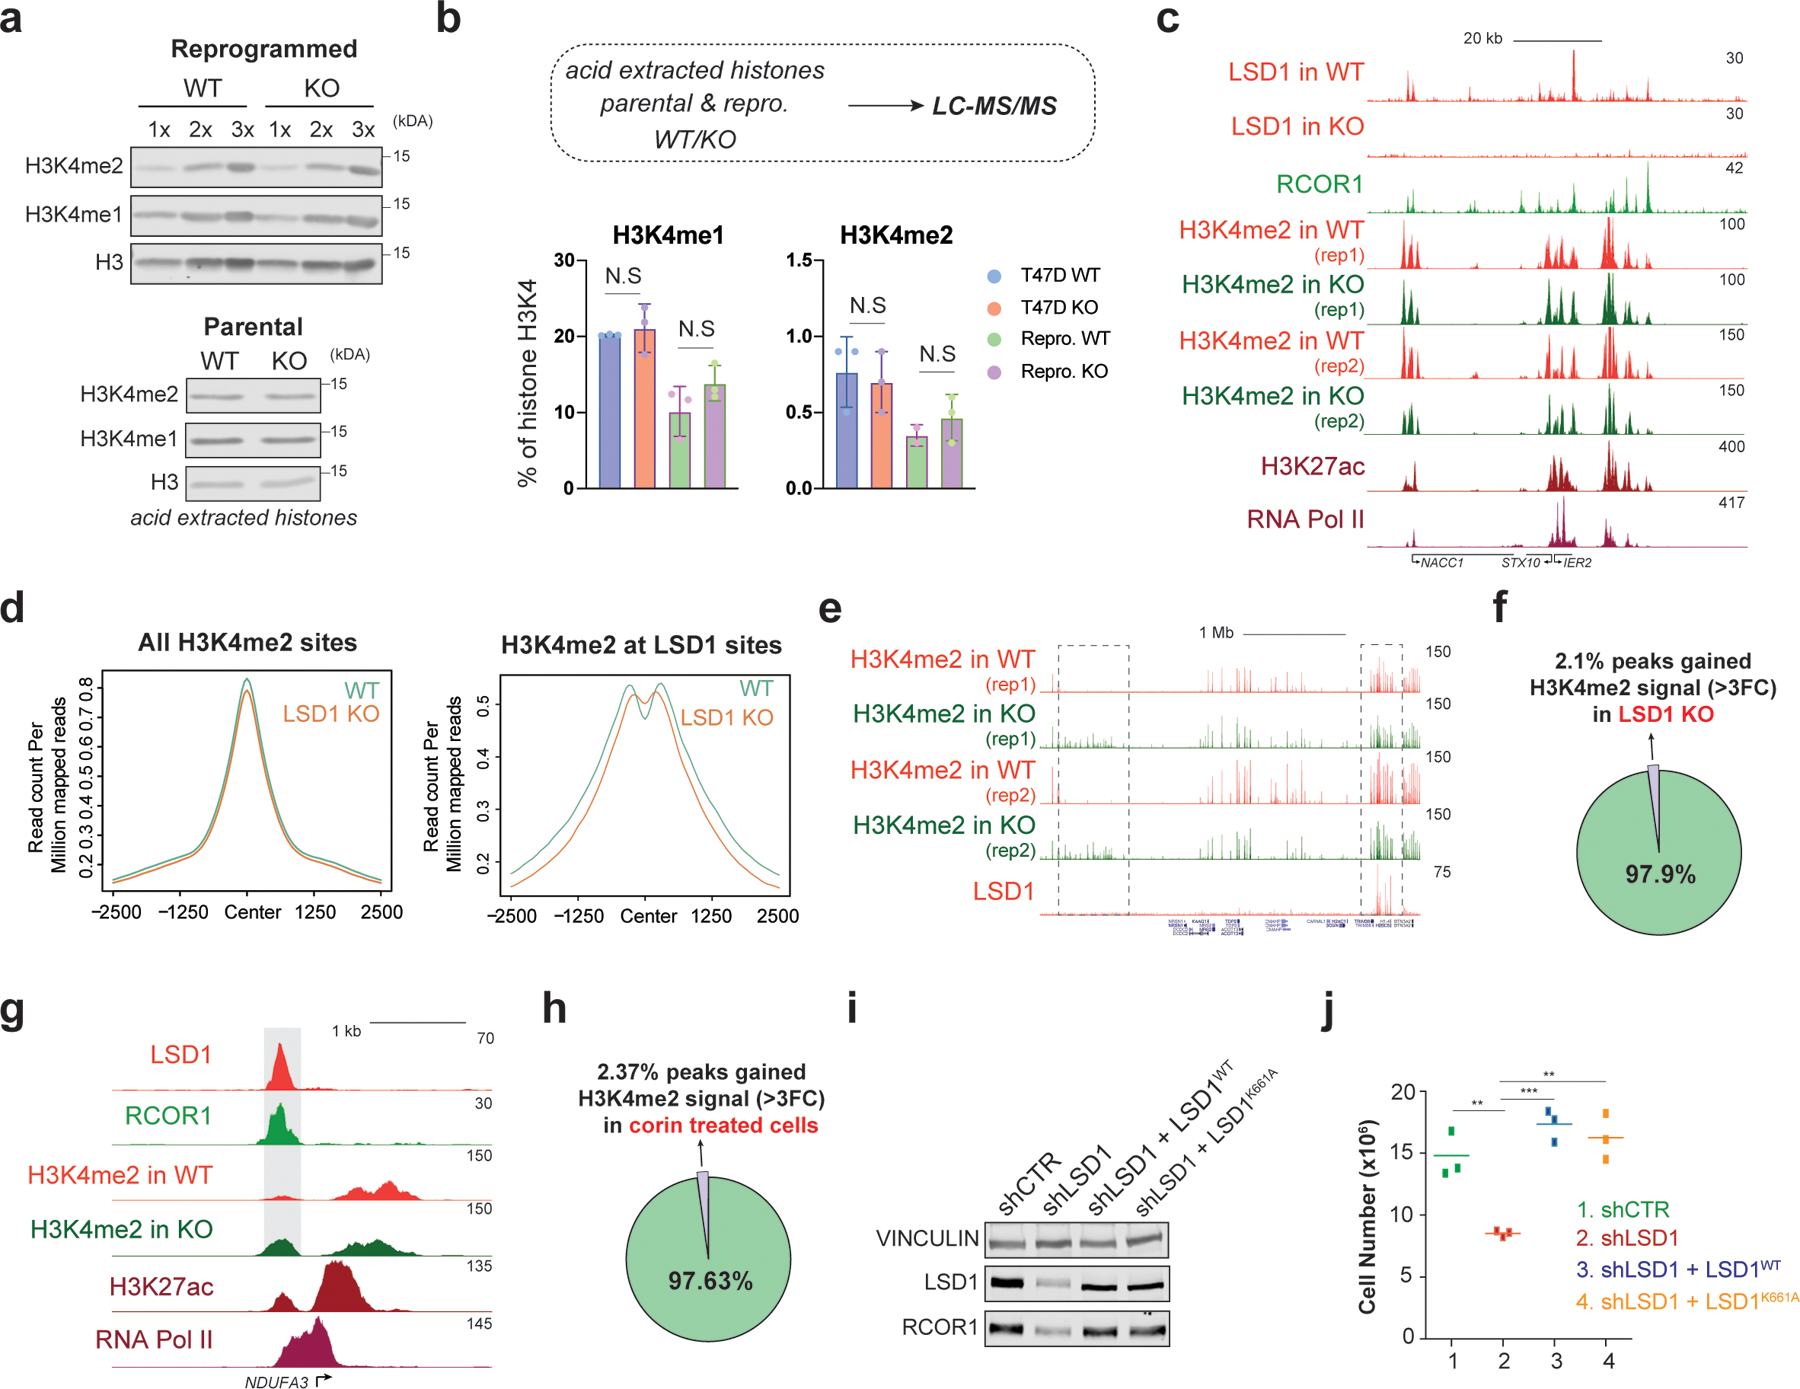
Fig. 4: The CoREST oncogenic program is independent of LSD1 enzymatic activity.

a, H3K4me1/2 WB (loaded in increasing concentrations) of reprogrammed T47D WT and LSD1 KO histone extracts with H3 as a loading control (top) and parental cells (bottom). b, H3K4me1/2 abundance in parental and reprogrammed LSD1 KO T47D by mass spectrometry (N.S., not significant). N = 3 biological independent replicates. Data are presented as mean values + SEM. two-way ANOVA. c, ChIP-seq signal at selected region in reprogrammed cells. d, H3K4me2 ChIP-seq signal at H3K4me2 (left) or LSD1 peaks (right) in reprogrammed WT and LSDI KO T47D. e, H3K4me2 and LSD1 ChIP-seq signal at selected region in WT and LSD1 KO reprogrammed cells. Note that H3K4me2 levels increased at sites without LSD1 (left box) and no changes in H3K4me2 at LSD1 targets (right box). f, Percentage of H3K4me2 peaks that gain signal (>3FC) in reprogrammed T47D following LSD1 KO compared to WT. g, LSD1, RCOR1, H3K4me2, H3K27ac, and RNA-Pol II ChIP-seq signal at the NDUFA3 promoter in reprogrammed cells. Shaded region H3K4me2 signal that is greater in LSD1 KO compared to WT. h, Percentage of H3K4me2 peaks at LSD1 targets that gain signal (>3FC) following 72h of 500nM corin treatment compared to DMSO. i, WB of proteins indicated from cells expressing WT LSD1 (LSD1WT) or a catalytically dead mutant (LSD1K661A). j, Proliferation of shLSD1 cells was restored after expressing either LSD1WT (p-value = 0.0003) or LSD1K661A (p-value = 0.0020), n = 3 biological independent replicates (two-tailed unpaired t-test). Uncropped images for a and i are available as source data.
