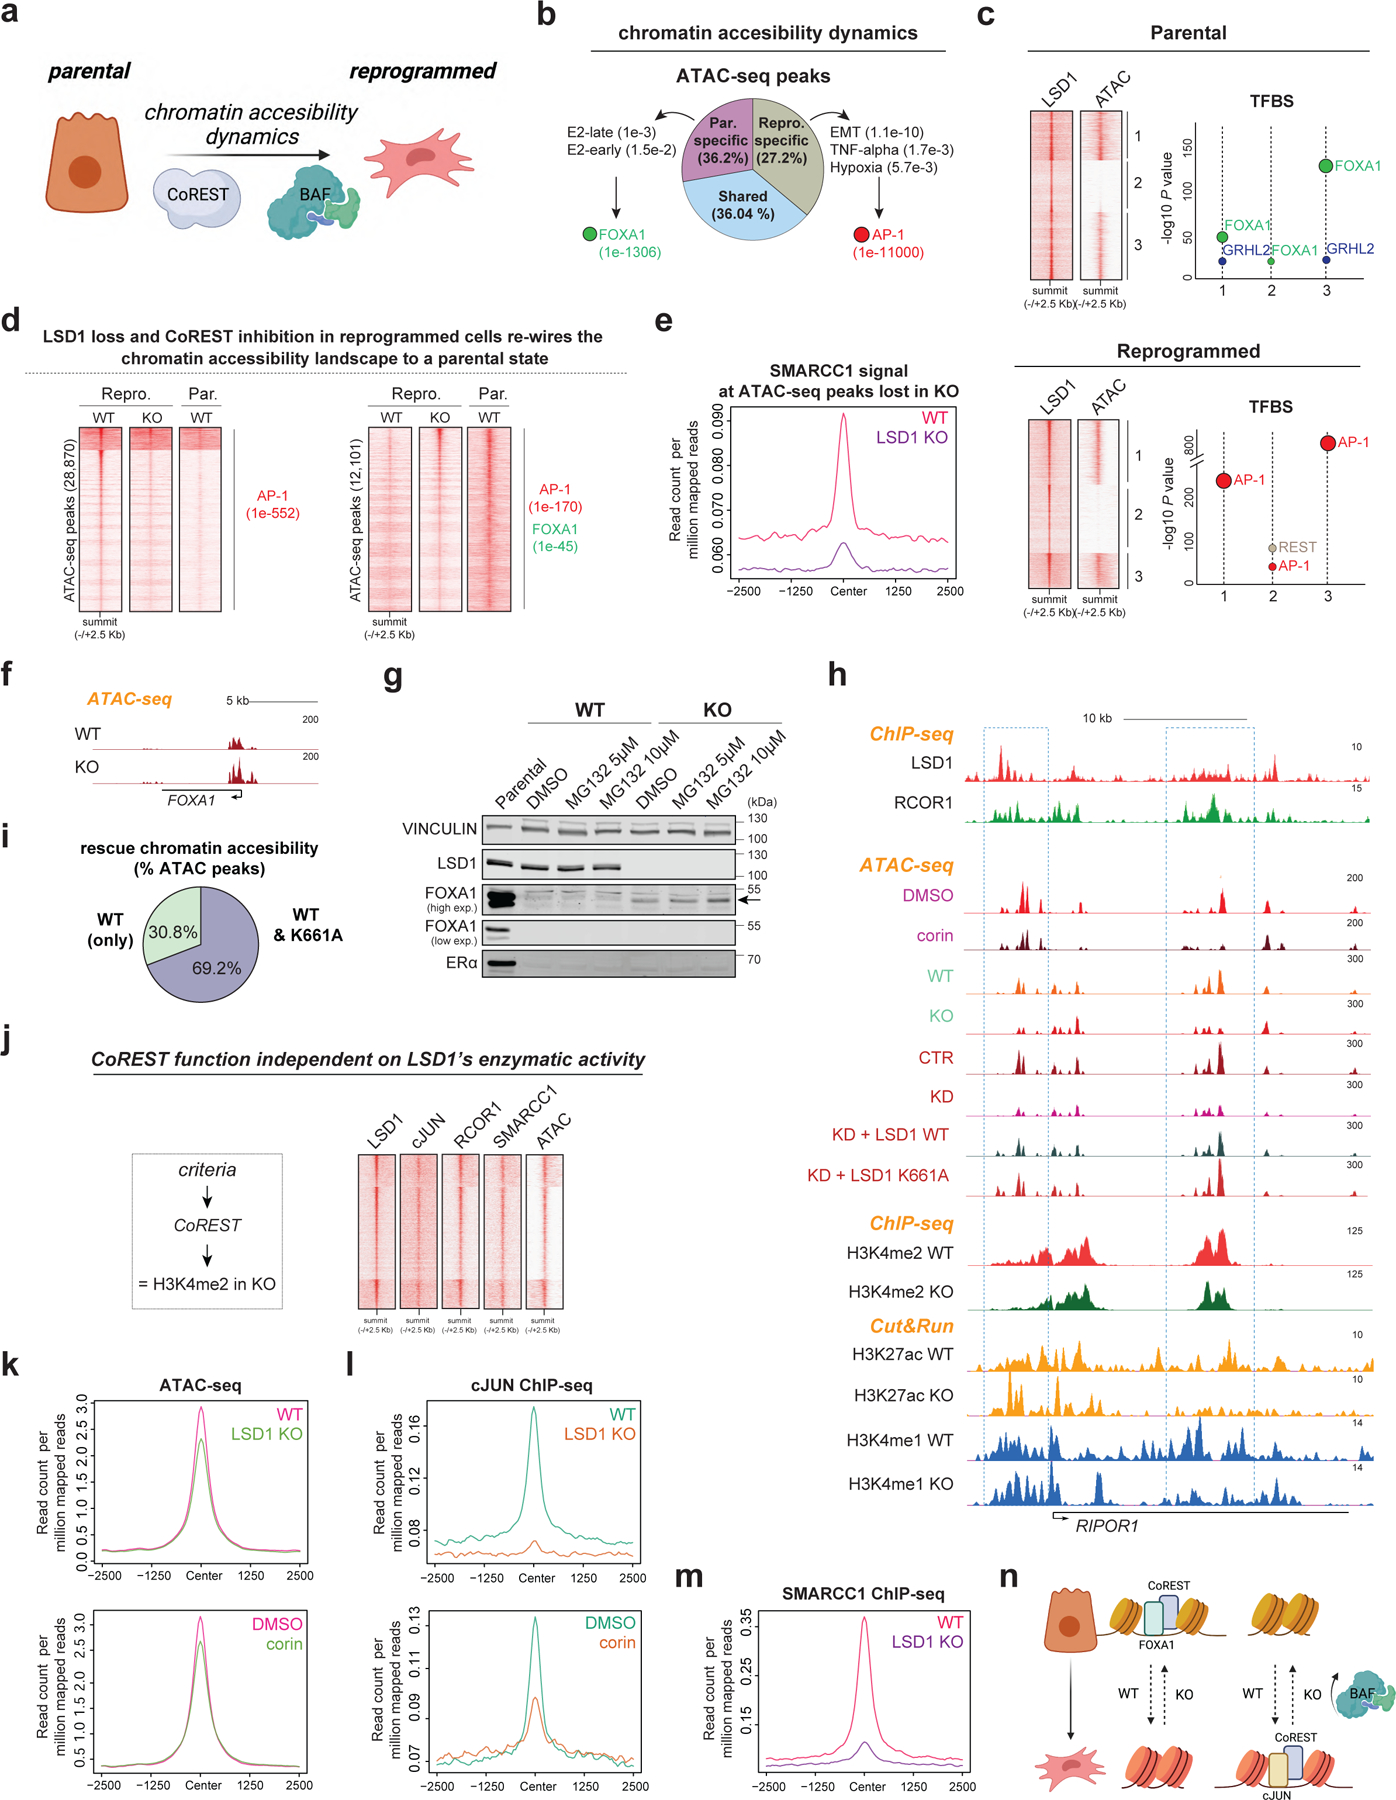
Fig. 6: Chromatin accessibility is regulated by CoREST.

a, Hypothesis. b, Percentage of common and specific ATAC-seq peaks in parental and reprogrammed T47D as well as GO analysis and enriched TF motifs of these peaks, p-values indicated in parentheses. E2, estrogen. c, LSD1 ChIP-seq and ATAC-seq signal at LSD1 binding sites (left) in parental cells and reprogrammed cells. Enriched TF motifs from LSD1 peaks in each cluster (right). d, ATAC-seq peaks in parental WT, LSD1 KO, and corin treated T47D. TF motifs of these peaks and p-values are indicated in parentheses. Homer motif analysis software utilizes cumulative binomial distribution statistics for motif enrichment. e, SMARCC1 ChIP-seq signal at ATAC-seq sites lost in LSD1 KO reprogrammed cells. f, ATAC-seq profile at FOXA1 locus in WT and LSD1 KO reprogrammed T47D. g, WB of parental, WT, and LSD1 KO reprogrammed T47D treated with MG132 for 72h. h, ChIP-seq, CUT&RUN, and ATAC-seq of factors indicated in reprogrammed WT and LSD1 KO T47D at RIPOR1. i, Percentage of ATAC-seq peaks rescued by LSD1WT only or both LSD1WT and LSD1K661A. j, LSD1, RCOR1, cJUN, and SMARCC1 ChIP-seq and ATAC-seq signal at sites with no changes in H3K4me2 levels. k-l, ATAC-seq signal (k) and cJUN ChIP-seq signal (l) at sites from (j) in reprogrammed WT, LSD1 KO and corin treated reprogrammed cells (72h). m, SMARCC1 ChIP-seq signal at sites from (j). n, Proposed model. Uncropped images for g are available as source data.
