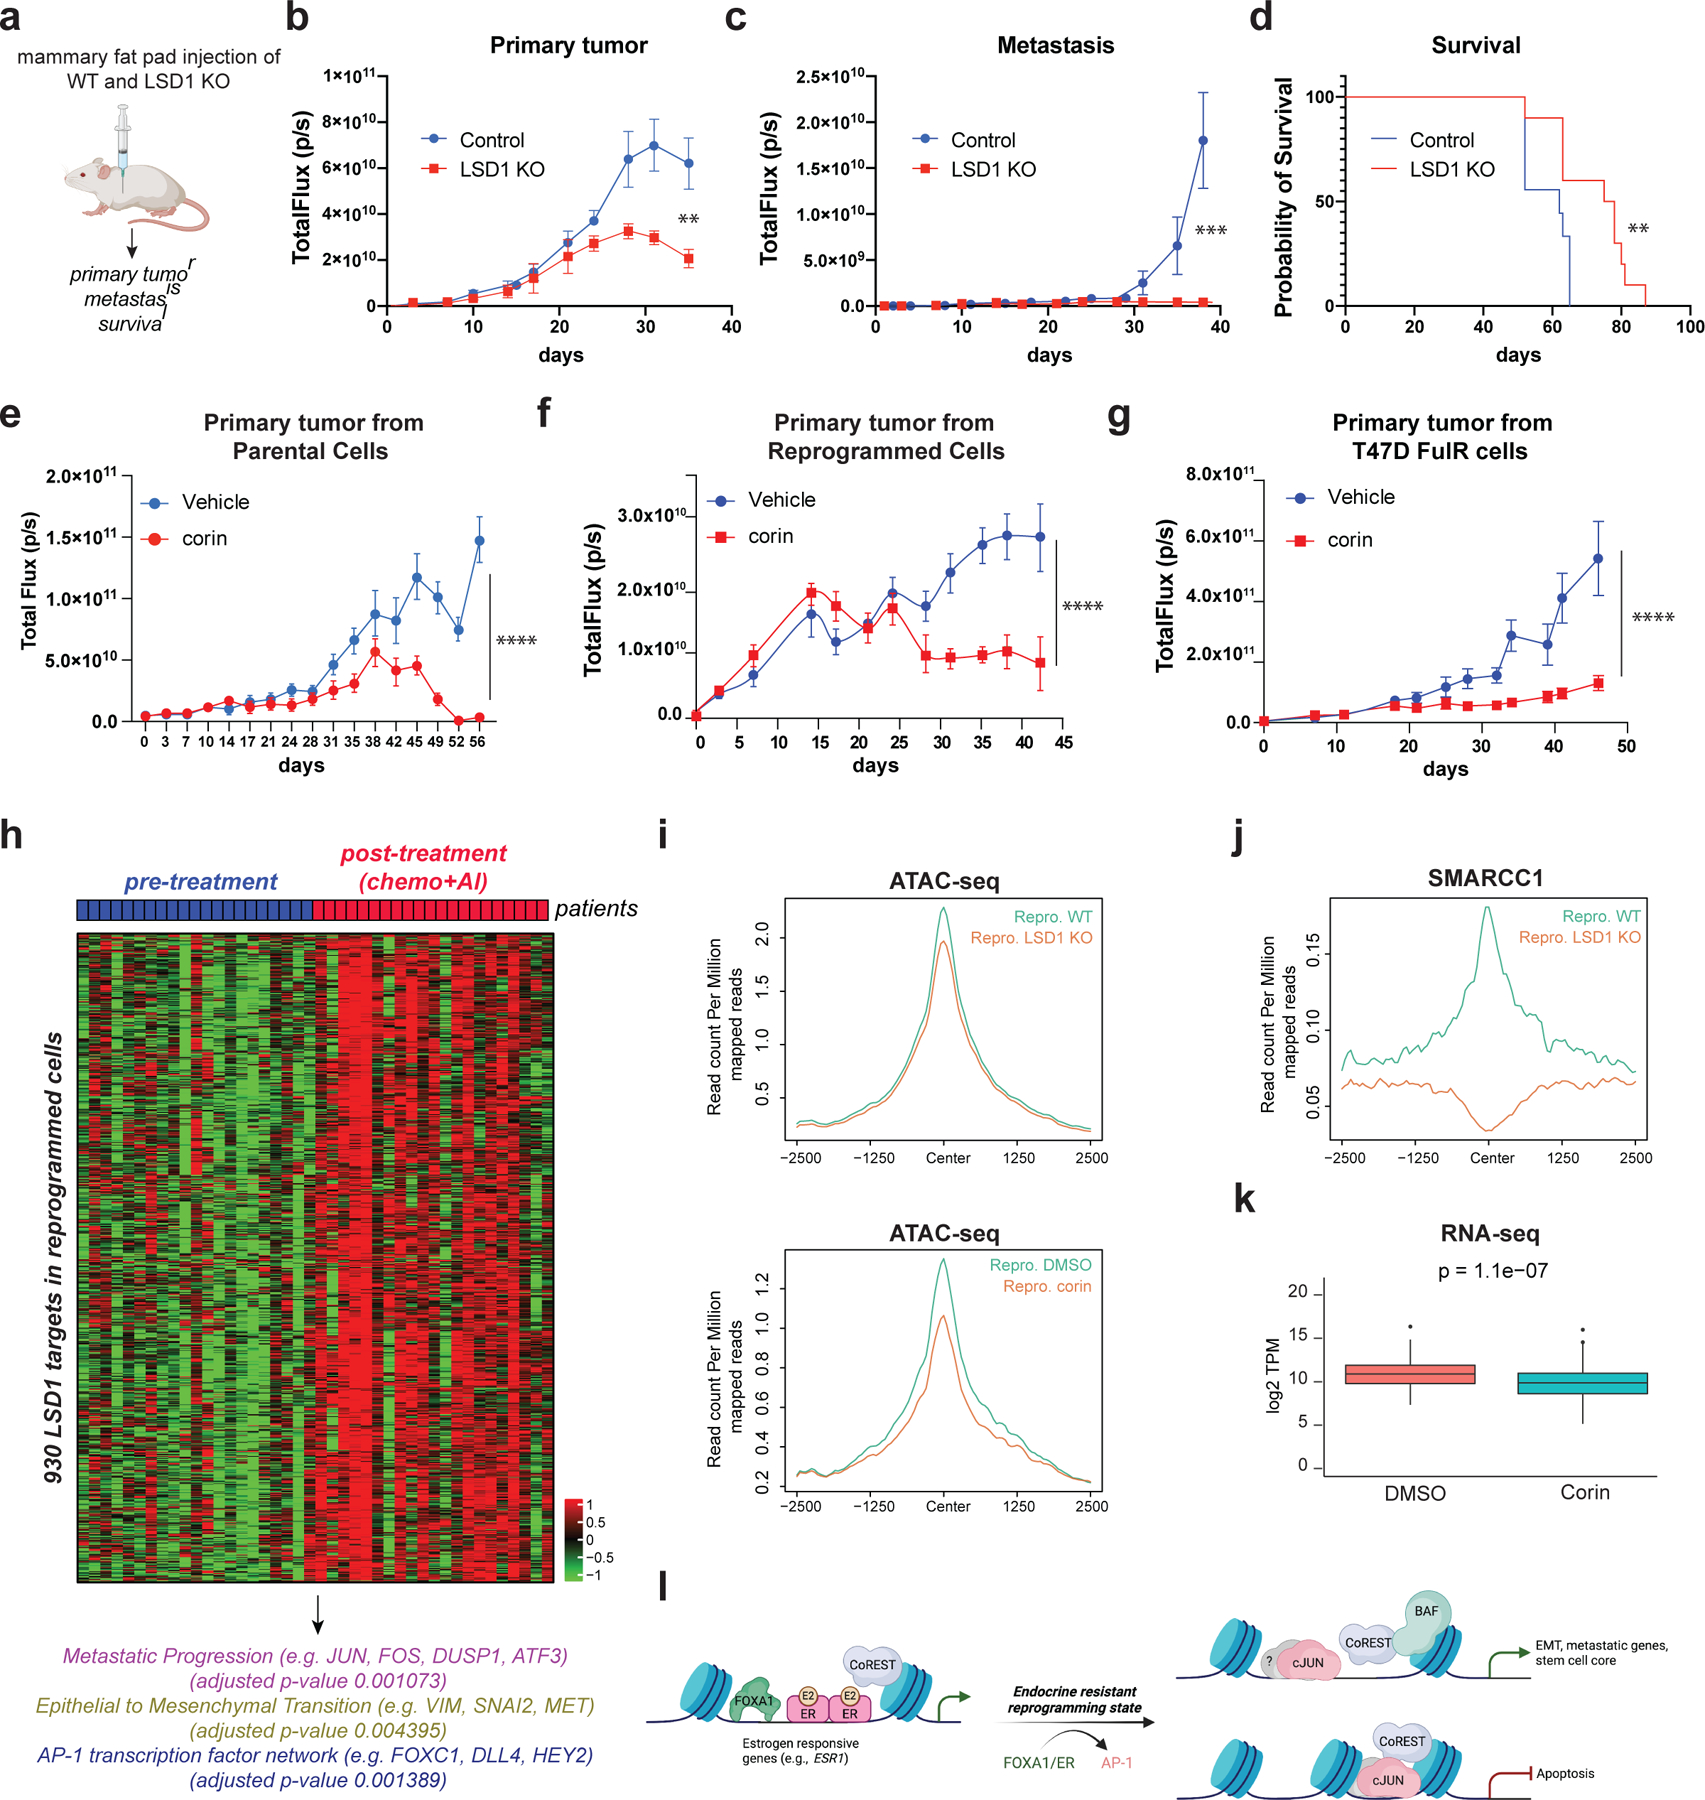
Fig. 7: CoREST promotes breast cancer tumorigenesis.

a, Schematic of experimental design (n = 10/group). b-c, Quantification of primary tumors (b) (p-value < 0.005; Two-way RM ANOVA) and metastatic lesions (c), (p-value < 0.001; unpaired two-tailed test). Data are presented as mean values + SD. d, Survival probability (p-value = 0.0082, Log-rank [Mantel-Cox test]). e-g, Quantification of parental (e), reprogrammed (f), and T47D-FulR (g) primary tumors (p-value < 0.001, n = 10/group, Two-way RM ANOVA). Data are presented as mean values + SEM. Mice were treated daily with vehicle or corin (7.5mg/kg). h, RNA-seq heatmap of 930 LSD1 target genes in patients resistant to chemo-endocrine treatment. i, ATAC-seq signal at the 930 LSD1 targets in WT and LSD1 KO reprogrammed T47D, and in reprogrammed cells treated with DMSO or 500nM of corin for 72h. j, SMARCC1 ChIP-seq signal at the 930 LSD1 targets in WT and LSD1 KO reprogrammed T47D. k, Expression of LSD1 targets in reprogrammed T47D treated with 500nM corin for 72h, (p-value = 1.1e-7, t-test, two-sided). The box plots span from the 25th to 75th percentiles, the center line shows the median and whiskers show maximum and minimum values). l, Proposed model.
