
Figure 1.
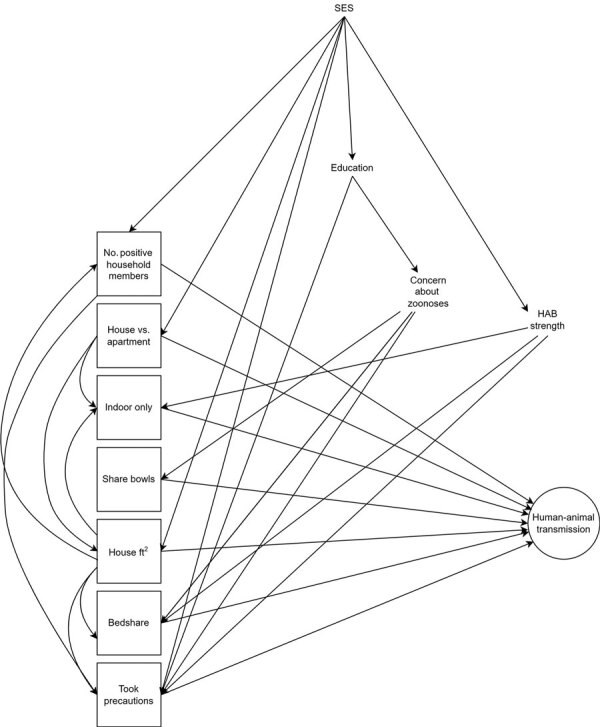
Directed acyclic graph for human‒animal transmission of SARS-CoV-2, Washington and Idaho, USA. Squares indicate exposures of interest and circles indicate outcomes (approximated by serostatus, PCR result, and illness in separate models). Measured and unmeasured confounders are included. SARS-CoV-2‒positive household member(s) took precautions to prevent transmission to pet. Indoor-only indicates the animal does not go outdoors; bedshare indicates the animal shares a bed with >1 household members. HAB, human‒animal bond; SES, socioeconomic status.