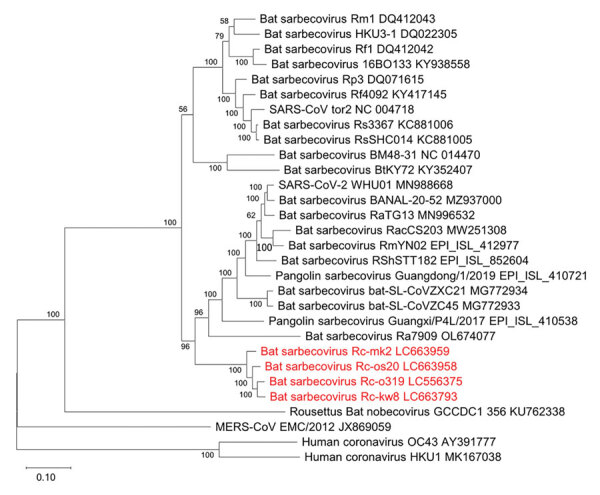
Figure 1.

Phylogenetic tree of sarbecoviruses from bats in Japan, generated by using the full-genome nucleotide sequences with the maximum-likelihood analysis combined with 500 bootstrap replicates. Red indicates strains isolated in this study. Bootstrap values are shown above and to the left of the major nodes. GenBank accession numbers are indicated. Scale bars indicate nucleotide substitutions per site.
