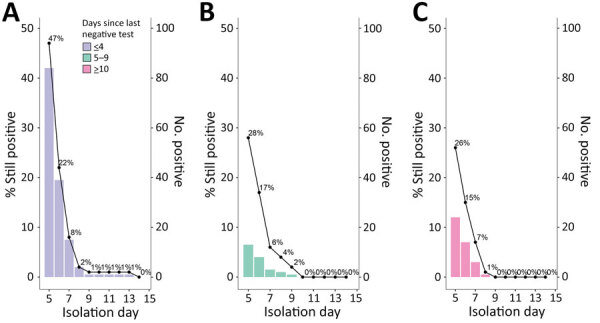
Figure.

Rapid antigen testing results by isolation day and positivity duration by days since the last negative test category in study of students isolated for positive SARS-CoV-2 results. Left axis shows percent still positive of the original study population; right axis shows the number tested positive on each isolation day. A) Last negative test ≤4 days earlier (N = 177). B) Last negative test 5–9 days earlier (N = 47). C) Last negative test ≥10 days before the earliest test (inconclusive or positive) (N = 91). One person was removed due to missing last negative test data, and 10 persons were removed due to testing inconclusive initially but counted the first positive test as day 0.
