
Figure 2.
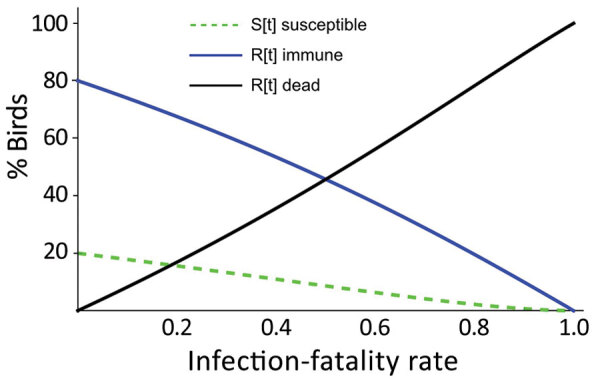
Model result for the introduction of highly pathogenic avian influenza (HPAI) A(H5N1) clade 2.3.4.4b viruses into a local Sandwich tern breeding colony population, the Netherlands. Graph demonstrates the distribution at the end of the local HPAI H5N1 outbreak, for dead (or departed) birds, escaping susceptible birds, and immune birds as a function of the infection-fatality rate (IFR), for a Sandwich tern population that was naive for HPAI H5N1 at the start of the local outbreak, for R0 = 2. The model output indicates that the fraction of birds infected with HPAI H5N1, and hence also the fraction that dies, will increase with infection-fatality rate and that at a rate above 90%, virtually no more susceptible birds remain, only immune or dead (or departed) birds.