
Figure 2.
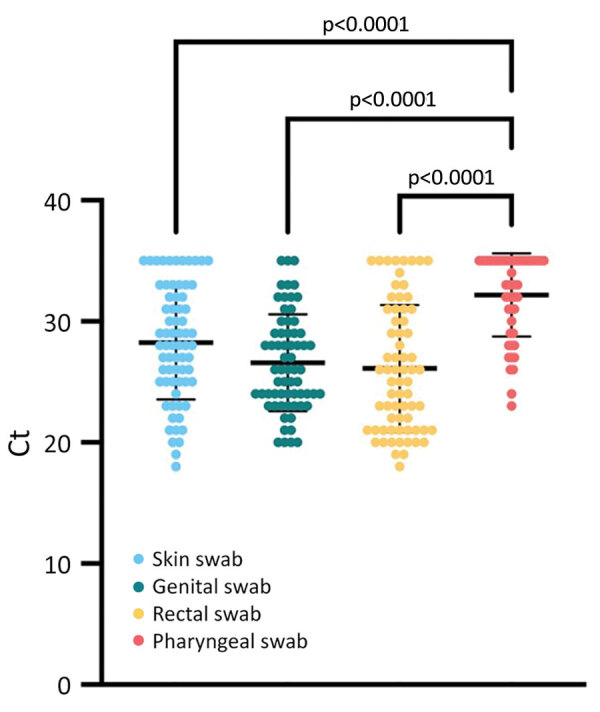
Comparison of monkeypox virus loads between different clinical sampling sites in an observational cohort study of evolving epidemiologic, clinical, and virological features of monkeypox in southern France, 2022. Each colored circle indicates a tested sample; thick horizontal lines indicate mean values; error bars indicate SD. We tested clinical samples for monkeypox virus by using quantitative PCR. We collected samples from skin (n = 69), genital (n = 67), rectal (n = 68), and pharyngeal (n = 50) swabs and calculated the mean Ct for each sample type. Viral loads were significantly lower in skin, genital, and rectal samples compared with pharyngeal samples. Ct, cycle threshold.