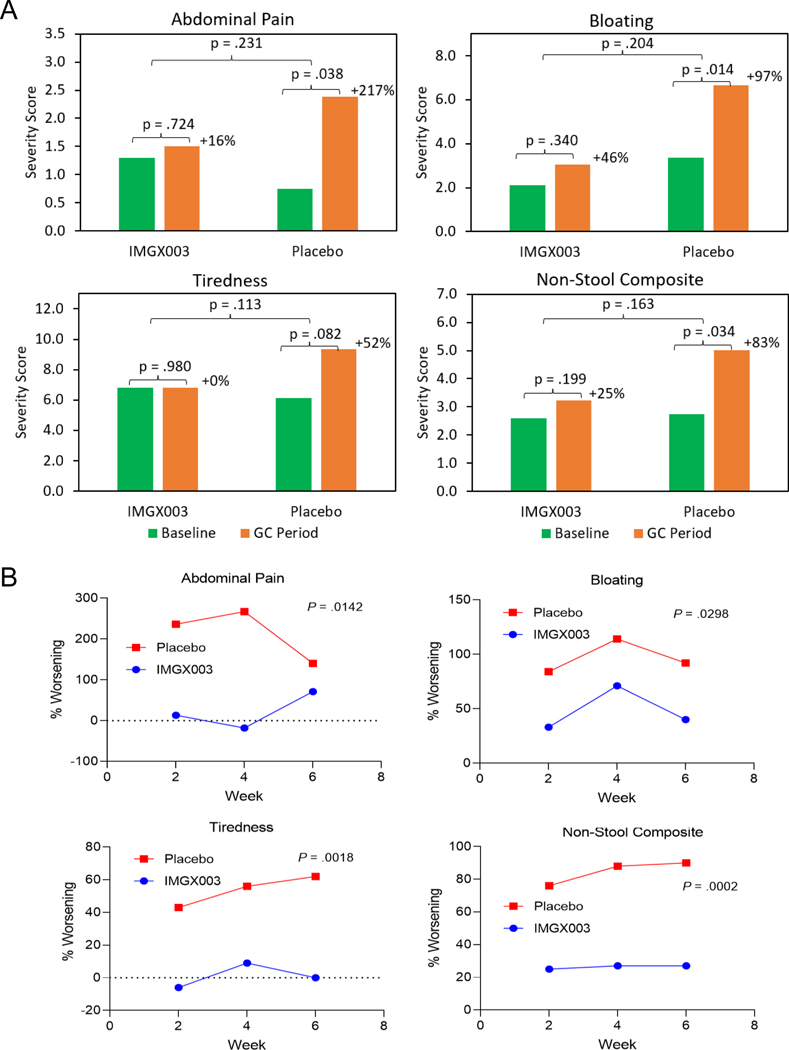
Figure 2.
Symptom results for abdominal pain, bloating, tiredness, and non-stool composite which includes these symptoms and nausea. (A) Absolute severity for baseline and the 6-week GC treatment period for IMGX003 vs. placebo groups. Also shown are the magnitude of worsening for baseline vs. 6-week GC period. P-values are by ANCOVA for inter-group and paired t-test for intra-group results. (B) Mean change from baseline (% worsening) for three 2-week sequential GC treatment periods for IMGX003 vs. placebo. Also shown are the unpaired, 2-tailed, t-test p-values.

