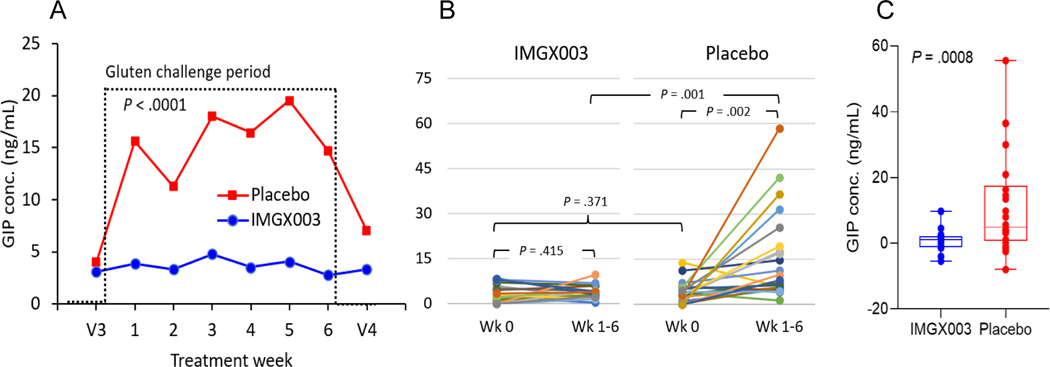
Figure 3.
(A) Mean gluten immunogenic peptide (GIP) concentration in urine before (V3), during (6 weekly readings) and after (V4) the GC treatment period with unpaired, 2-tailed, t-test p-value. (B) Subject responses for GIP concentration in urine showing individual subject changes. (C) Box and whisker plot showing min and max, 1st and 3rd quartile and median and ANCOVA p-value.

