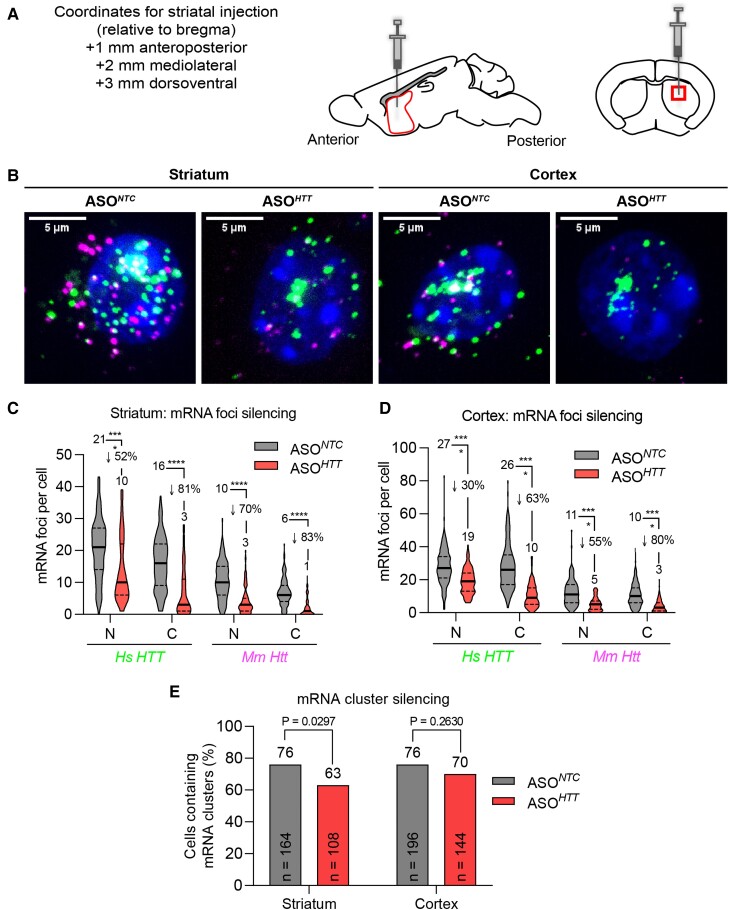
Figure 6.
ASOs efficiently silence wild-type Mm Htt and Hs HTT mRNA foci but not nuclear clusters. (A) ASONTC and ASOHTT (40 µg in 2 µl; n = 3 animals per group) were administered by unilateral intra-striatal bolus microinjection in 3-month-old YAC128 mice and euthanized 3 weeks later for analysis. Schematic diagram of sagittal and coronal sections through the mouse striatum at the site of injection is shown. The striatal region selected to acquire the images (box) is indicated. (B) FISH detection of Mm Htt and Hs HTT mRNAs in striatum (left) and cortex (right). Nuclei labelled with Hoechst. Representative images are maximum Z-projections through the nuclear region spaced 0.5 µm apart. Scale bar, 5 µm. (C, D) Quantification of Hs HTT and Mm Htt mRNA foci silencing in striatum (C) and cortex (D). N = nucleus, C = cytoplasm (n = 100–200 cells analysed per brain region per group pooled from three mice, *P < 0.05, **P < 0.01, ***P < 0.001, ****P < 0.0001, one-way ANOVA, Bonferroni’s multiple comparisons test). (E) Quantification of mRNA cluster silencing in striatum and cortex (P value calculated using Fisher’s exact test). ASO, antisense oligonucleotide; NTC, non-targeting control. See also Supplementary Table 2.

