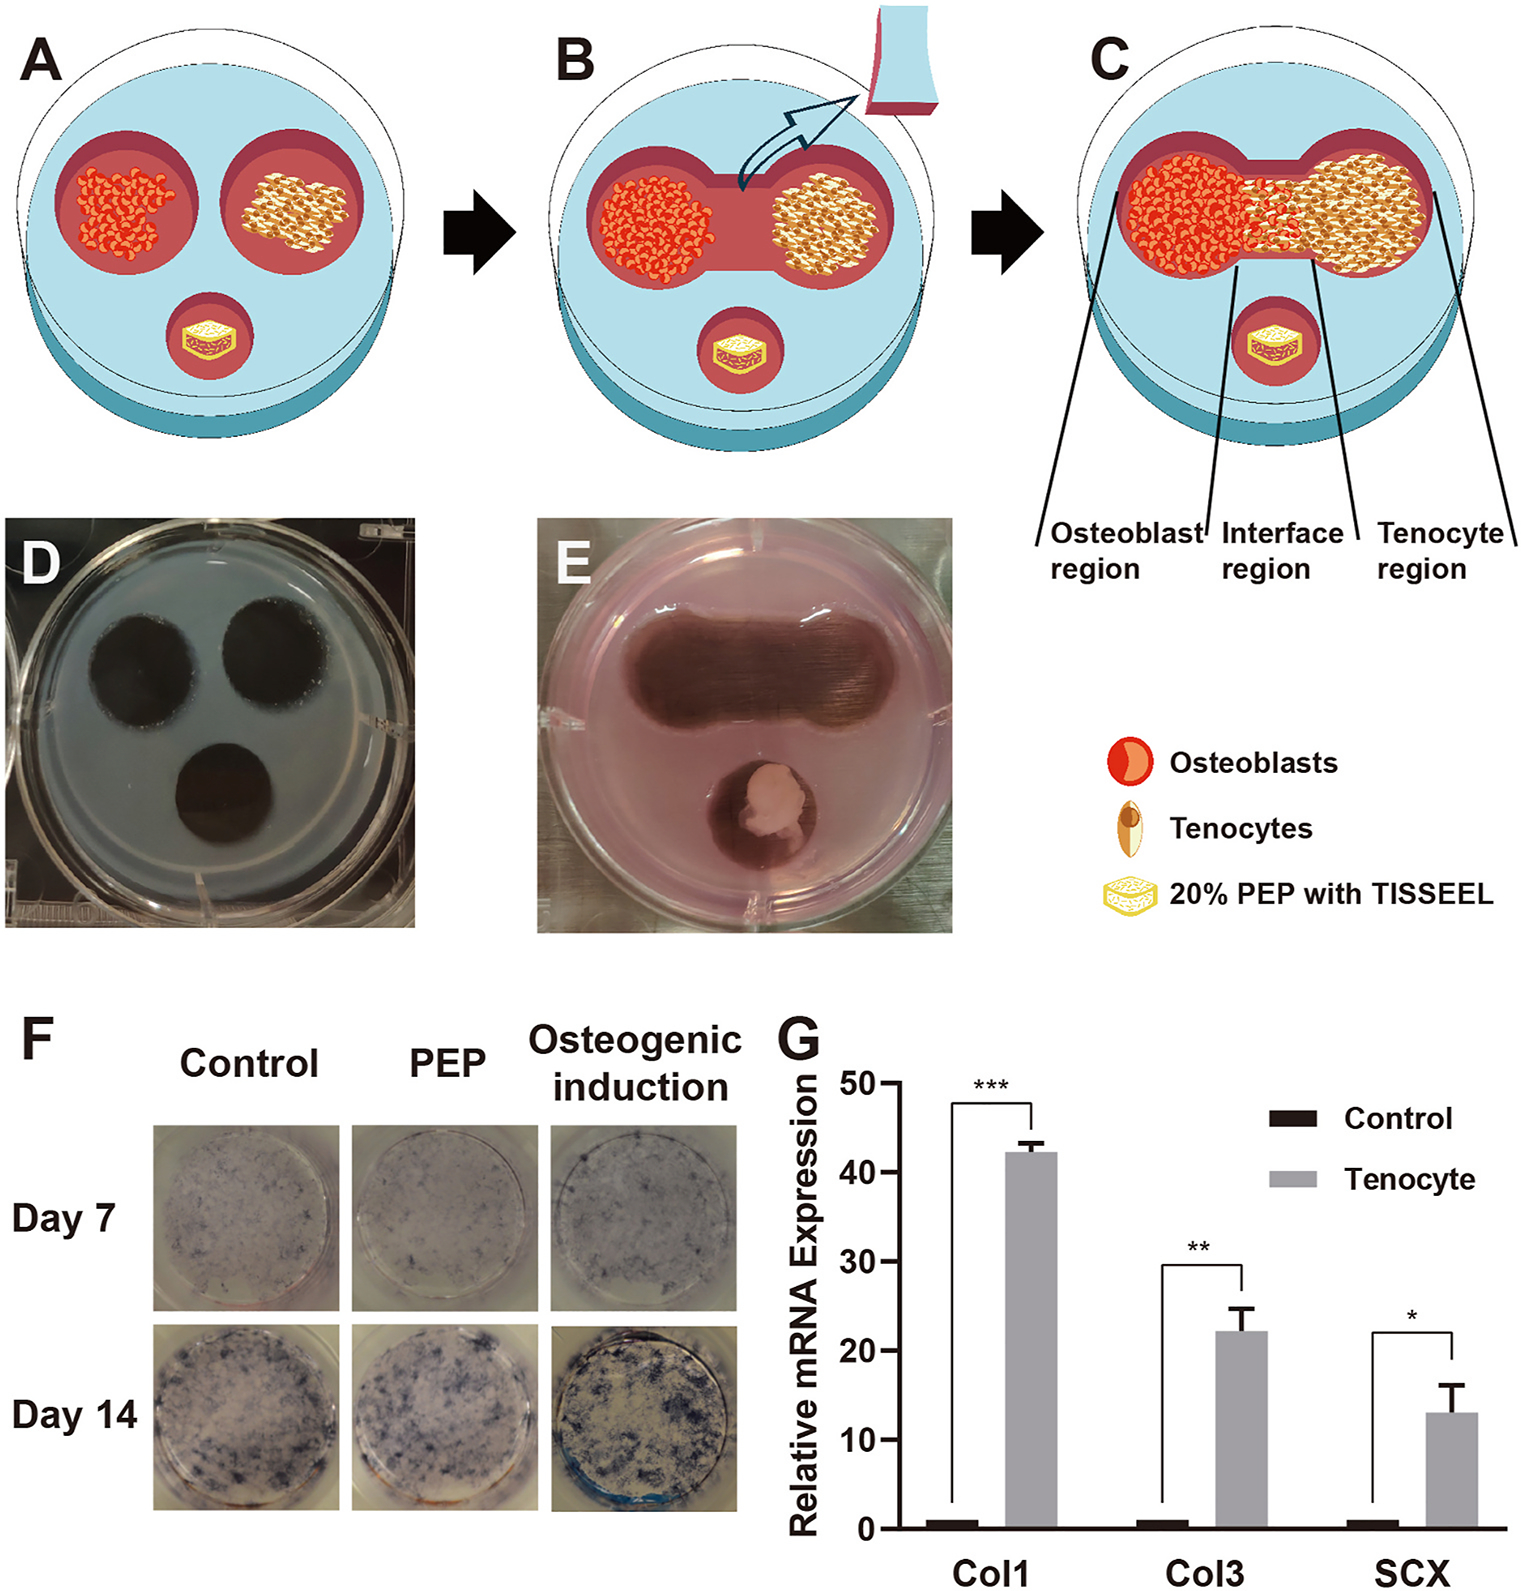
Fig. 1. Co-culture model and cell identification.

A, Schematic representation of the co-culture model, composed of osteoblasts, tenocytes, and PEP gel cube. B, The boundary was cut and moved when cells reached the boundary. C, Schematic representation of the osteoblast region, tenocyte region, and interface region in the co-culture model. D, Photograph of the co-culture model before and, E, after the boundary moved. F, Alkaline phosphatase staining after application of normal culture medium, with PEP or osteogenic induction conditions, day 7 and day 14. G, Relative mRNA expression levels of Col1, Col3, and SCX in primary tenocytes (osteoblasts as the control group). ALP indicates alkaline phosphatase; PEP, purified exosome product; *, P < .1; **, P < .01; ***, P < .001.
