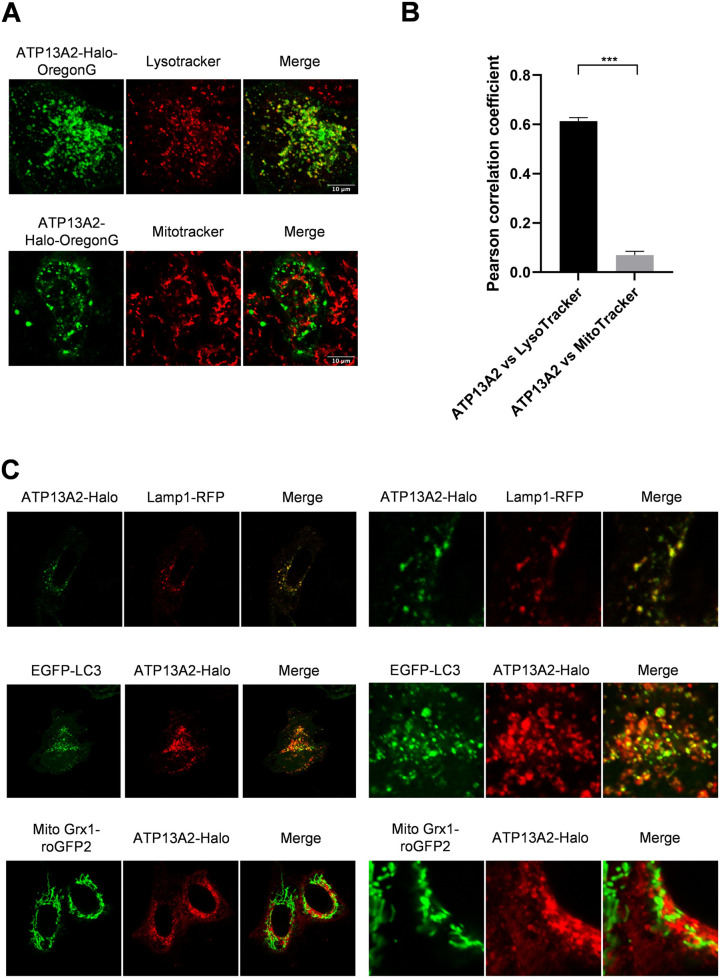
Fig 2. Intracellular localization of ATP13A2-Halo in HeLa cells.
(A) Images of live cells stained with indicated fluorophores. ATP13A2-Halo was labeled with Oregon Green by utilizing Halo link technology. Scatter plots are also shown in S2 Fig (B) Pearson correlation coefficients of ATP13A2-Halo and Lysotracker or Mitotracker. Data represent averages of n = 10 samples with S.E.M. (bars). Statistical analysis was performed using Student’s t test: *p < 0.05, ** p < 0.01, *** p < 0.001. (C) Organelle-specific proteins were cotransfected with ATP13A2-Halo. For obtaining high resolution images, cells were fixed and subjected to immunostaining using anti-ATP13A2 antibody.

