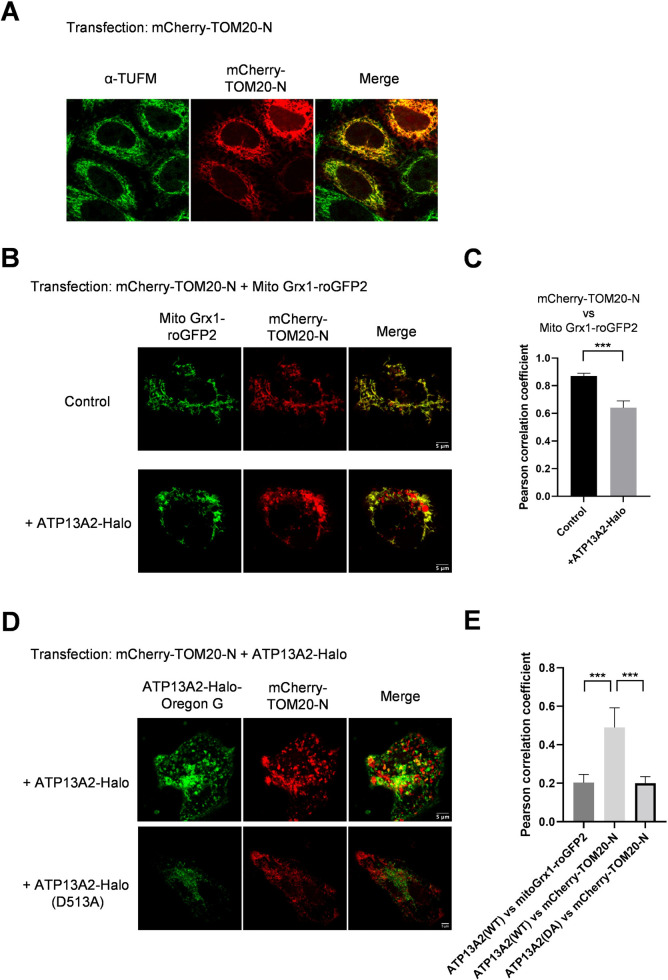
Fig 3. ATP13A2 overexpression altered the intracellular distribution of mCherry-TOM20-N (mitochondrial outermembrane, MOM).
(A) MOM protein, mCherry-TOM20-N, was overexpressed in HeLa cells and mitochondrial localization was confirmed by immunostaining; TOM20 exhibited complete colocalization with the endogenous mitochondrial protein, TUFM. (B) Mitochondria was visualized by mitochondrial intermembrane space (IMS)/matrix marker, mito Grx1-roGFP2. Upon co-overexpression of ATP13A2, substantial portion of mCherry-TOM20-N appeared as particulate structures. Scatter plots are also shown in S3 Fig (C) Pearson correlation coefficients of mCherry-TOM20-N and mito Grx1-roGFP2 are shown. Data represent averages of n = 10 samples with S.E.M. (bars). Statistical analysis was performed using Student’s t test: *p < 0.05, ** p < 0.01, *** p < 0.001. (D) mCherry-TOM20-N and ATP13A2-Halo were coexpressed and their localizations were analyzed by live-cell imaging. TOM20 showed mixed localization pattern with mitochondria-like tubular shapes and particulate structures. The latter signals substantially merge with ATP13A2-positive vesicles. Catalytically dead mutant of ATP13A2 (D513A) produced no effect on the localization pattern of mCherry-TOM20-N. Scatter plots are also shown in S4 Fig (E) Pearson correlation coefficients of indicated proteins are shown. Data represent averages of n = 10 samples with S.E.M. (bars). Statistical analysis was performed using Student’s t test: *p < 0.05, ** p < 0.01, *** p < 0.001.

